Dass in Zeiten des Klimawandels das Anormale, das Normale ist, das ist eigentlich keine Besonderheit. Aber sehr deutlich kann man das derzeit an den Meerestemperaturen im Nordatlantik und den Lufttemperatursprüngen in der Antarktis beobachten.
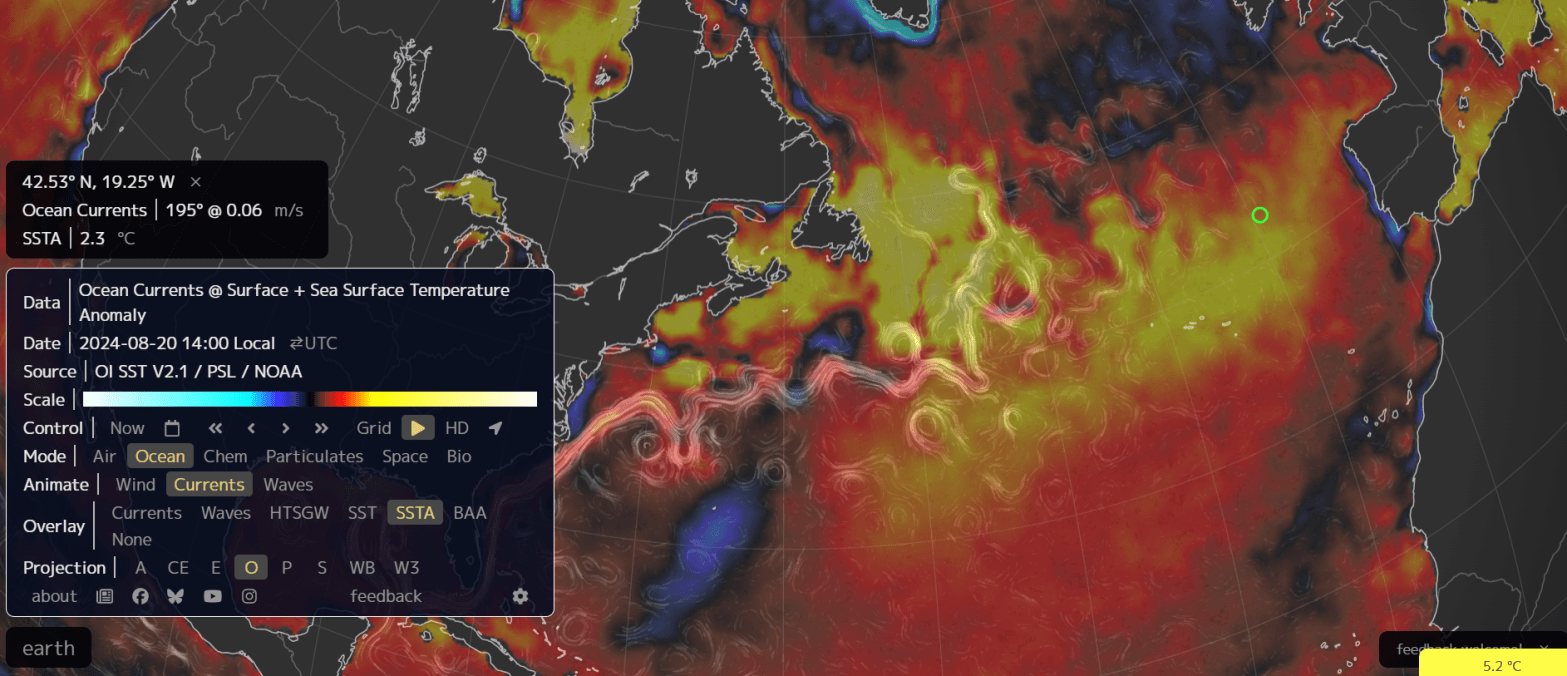
Die obige Aufnahme zeigt den Nordatlantik zwischen der amerikanischen Nordostküste und Süd Neufundland und Europa (Spanien/Frankreich) bzw. Nordafrika. Am oberen mittleren rechten Rand sieht man die Südspitze Grönlands.
Seit 2010 bzw. 2014 beobachtet man südlich der Südspitze Grönlands zwei entgegengesetzte Temperaturzonen.
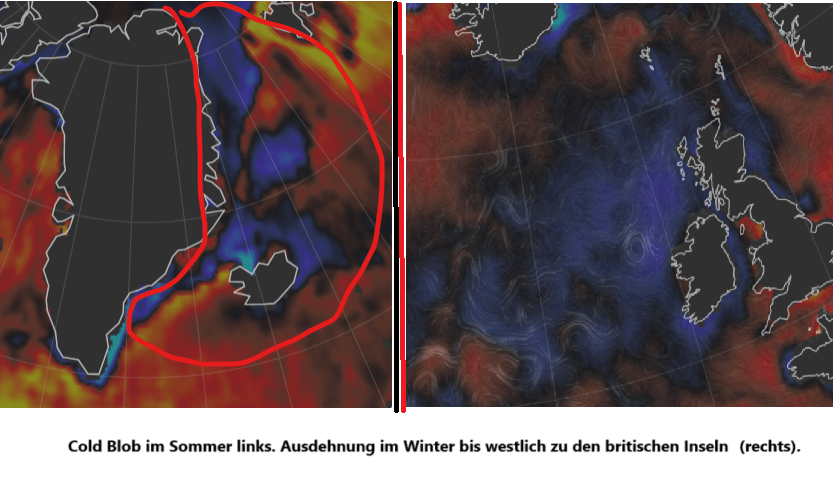
Zum einen gibt es eine Kälteanomalie im Nordatlantik, die sich südlich von Grönland und Island sowie westlich der Britischen Inseln befindet. Dieses Gebiet zeichnet sich durch ungewöhnlich kalte Oberflächentemperaturen des Meeres aus, die sich stark von der allgemeinen Erwärmung der Weltmeere abheben. Es variiert in seiner Ausdehnung, erstreckt sich aber oft von der südlichen Spitze Grönlands bis in die Nähe von Island und erreicht die westlichen Teile der Britischen Inseln. Es kann bis zu Hunderttausende von Quadratkilometern umfassen
Nordatlantik: Cold Blob im Sommer (links), Winter (rechts)
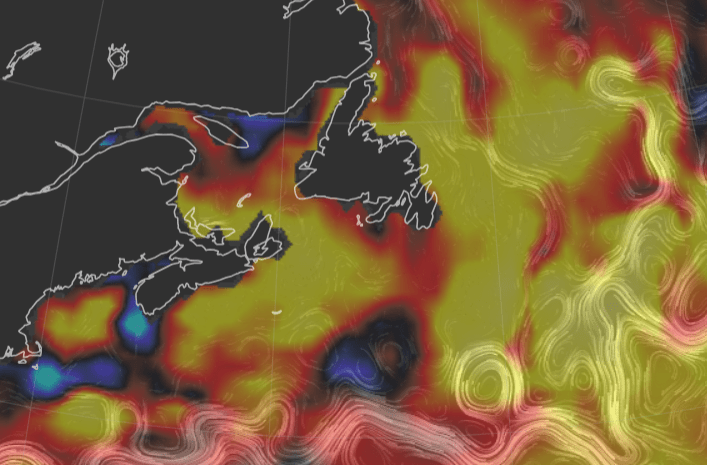
Der deutsche Ozeanograf und Klimaforscher Stefan Rahmstorf hat diesem Gebiet den Namen “Cold Blob” gegeben. Gleichzeitig bildete sich südwestlich von Grönland an der Nordostküste Amerikas und westlich von Südneufundland eine Temperaturzone mit starker positiver Temperaturanomalie, derzeit mit einer Temperaturanomalie von +5 Grad:
Nordatlantik: Warmzone vor der Nordostküste Amerikas und um Südneufundland.
Die Erwärmung der Meeresoberflächentemperaturen entlang der Nordostküste Amerikas und vor der Südküste Neufundlands, die zeitgleich mit der Entstehung des sogenannten ‘Cold Blob’ im Nordatlantik auftrat, wurde erstmals in den 2010er Jahren verstärkt wahrgenommen. Diese Phänomene wurden im Zusammenhang mit Studien zur Abschwächung der Atlantischen Meridionalen Umwälzströmung (AMOC) intensiv untersucht.
Der „Cold Blob“ wird als Folge einer schwächeren Nordatlantischen Tiefenwasserbildung gesehen, was dazu führt, dass weniger kaltes Wasser in die Tiefe sinkt und mehr Wärme im Süden bleibt. Gleichzeitig führt dies dazu, dass die Küstengewässer entlang Nordamerikas stärker erwärmt werden, da das warme Oberflächenwasser nicht wie üblich in den Norden transportiert wird, sondern sich entlang der Küste ansammelt.
Der Prozess lässt sich folgendermaßen erklären:
Gletscherschmelze und Süßwasserzufuhr: Durch die globale Erwärmung schmelzen die Gletscher in Grönland schneller, was zu einer erhöhten Menge anSüßwasser führt, das in den Nordatlantik gelangt. Süßwasser hat eine geringere Dichte als salzhaltiges Meerwasser.
Reduzierte Dichte und Tiefenwasserbildung: Dieses Süßwasser verringert die Dichte des Oberflächenwassers im Nordatlantik, was die Tiefenwasserbildung behindert. Normalerweise sinkt kaltes, salzhaltiges Wasser im Nordatlantik in die Tiefe und treibt damit einen wesentlichen Teil der AMOC an.
Schwächung der AMOC: Wenn weniger kaltes, dichtes Wasser in die Tiefe sinkt, wird die gesamte Zirkulation der AMOC geschwächt. Weniger kaltes Tiefenwasser, das nach Süden transportiert wird, bedeutet auch, dass weniger warmes Wasser aus den Tropen nach Norden gezogen wird.
Wärmeres Wasser entlang der nordamerikanischen Küste: Da das warme Wasser aus den Tropen nicht wie gewohnt nach Norden transportiert wird, sammelt es sich an der Nordostküste Nordamerikas und vor Neufundland. Dadurch entstehen dort ungewöhnlich hohe Oberflächentemperaturen.
Der Schmelzwasserzufluss von Grönland in den Atlantik hat seit 1990 signifikant zugenommen, und dieser Anstieg lässt sich in verschiedenen Studien quantifizieren.
Anstieg des Schmelzwasserzuflusses:
1990er Jahre: In den frühen 1990er Jahren lag der Schmelzwasserzufluss von Grönland bei etwa 50-100 Gigatonnen (Gt) pro Jahr. Eine Gigatonne entspricht 1 Milliarde Tonnen Wasser.
2000er Jahre: In den 2000er Jahren stieg dieser Wert auf etwa 200-300 Gt pro Jahr, was eine Verdopplung oder Verdreifachung im Vergleich zu den 1990er Jahren bedeutet.
2010er Jahre bis 2020: In den letzten Jahren hat der Schmelzwasserzufluss weiterhin zugenommen, wobei einige der höchsten jährlichen Schmelzraten über 400 Gt pro Jahr lagen, insbesondere in besonders warmen Sommern. Ein besonders extremes Jahr war 2019, als Grönland etwa 532 Gt Eis verlor.
Prozentuale Zunahme:
Im Vergleich zu den frühen 1990er Jahren hat sich der Schmelzwasserzufluss von Grönland bis in die 2010er Jahre etwa vervierfacht. Der Schmelzwasserzufluss hat in einigen Jahren sogar mehr als das Vierfache der Werte von 1990 erreicht, was die dramatische Beschleunigung der Eisschmelze verdeutlicht.
Gesamtverlust an Eis:
Zwischen 1992 und 2020 hat Grönland insgesamt etwa 4.000 Gigatonnen Eis verloren. Dieser Verlust trägt signifikant zum Anstieg des globalen Meeresspiegels bei, wobei der Beitrag Grönlands zum Meeresspiegelanstieg mittlerweile etwa 1 Millimeter pro Jahr beträgt.
Diese Zahlen belegen deutlich, dass die Menschheit ein deutliches Problem mit dem Abtauen Grönlands hat. Nur ein Abbremsen des globalen Temperaturanstiegs kann zumindest Zeit geben, um Schutzmaßnahmen für die Küsten besser vorzubereiten. Dass der Abschmelzvorgang noch aufzuhalten ist, bezweifle ich zumindest. Was passiert, wenn der AMOC als Wärme/Kälte Transportband ausfällt, kann hier nachgelesen werden:
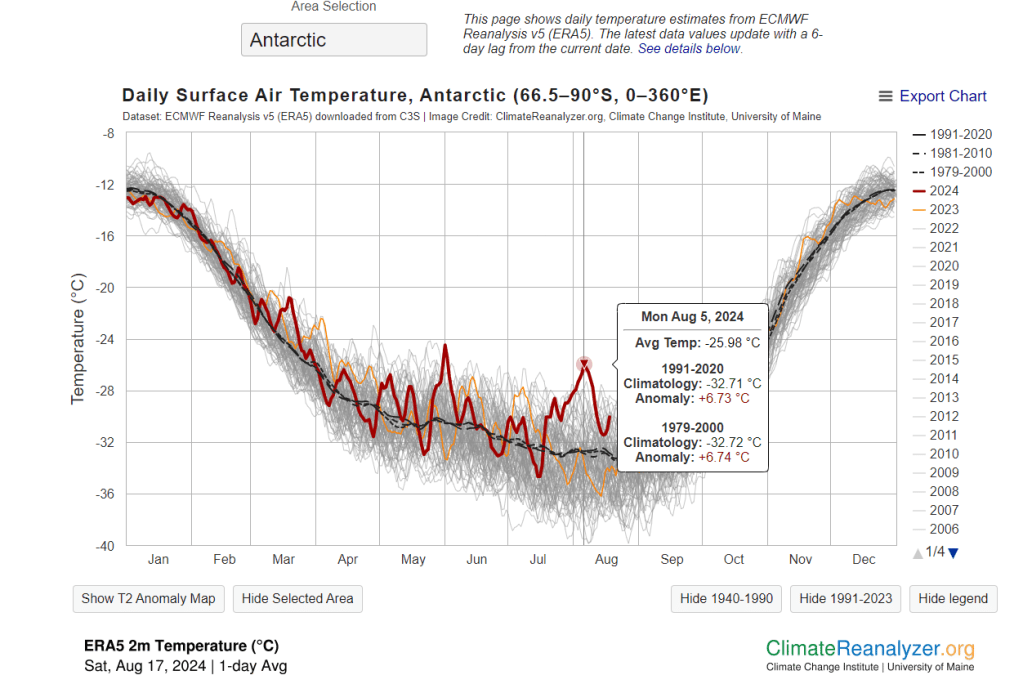
Auch die Antarktis zeigt im August 2024 besorgniserregende Daten:
Oberflächentempertur am Südpol 2024 (rote Kurve)
Am 5. August 2024 zeigte das Thermometer am Südpol -25,98 Grad, was natürlich immer noch kalt ist, aber nicht für den Südpol, der zu dieser Zeit schon länger in totaler Finsternis weilt. Kein einziger Sonnenstrahl erreicht ihn um diese Zeit.
Klimaforscher haben in den letzten Jahren zunehmend Hinweise darauf gefunden, dass die Westantarktis durch den menschengemachten Klimawandel destabilisiert wird. Die Westantarktis ist besonders anfällig für Erwärmung, da ihre Eismassen teilweise auf unter dem Meeresspiegel liegendem Land ruhen, was sie empfindlicher gegenüber Ozeanerwärmung macht.
Ein wesentlicher Grund zur Besorgnis ist der Rückgang des Westantarktischen Eisschildes, insbesondere im Bereich des Thwaites-Gletschers, der oft als “Doomsday Glacier” bezeichnet wird. Diese Region verliert seit Jahrzehnten Eis und trägt somit direkt zum globalen Meeresspiegelanstieg bei. Wissenschaftler beobachten, dass sich dieser Prozess beschleunigen könnte, wenn die Erwärmung weiter voranschreitet.
Die Destabilisierung könnte potenziell katastrophale Auswirkungen haben, da ein Kollaps dieses Eisschildes den Meeresspiegel weltweit um mehrere Meter anheben könnte. Zwar sind die Zeithorizonte für solch dramatische Ereignisse noch ungewiss und könnten Jahrzehnte bis Jahrhunderte in Anspruch nehmen, aber der Prozess hat begonnen, und die Besorgnis der Wissenschaftler ist entsprechend groß.
Dieser Blog basiert auf dem Buch Können wir die Welt verstehen? von Josef M. Gassner und Jörn Müller, insbesondere auf Kapitel 5. Das Buch wird von einer gleichnamigen YouTube-Reihe begleitet, die ich Physikinteressierten wärmstens empfehlen kann: von Aristoteles zur Stringtheorie. Neben der Physik wird in faszinierender Weise die Geschichte des menschlichen Erkenntnisgewinns über die Natur und ihre Ursprünge dargestellt. Auch ihr Folgeband “Kosmologie. Die größte Geschichte aller Zeiten”ist an Dramatik kaum zu überbieten.
Zu Beginn des 20. Jahrhunderts veränderten zwei neue Strömungen in der Physik das Weltbild der Menschheit grundlegend. Einerseits ebnete Max Planck mit seiner theoretischen Erklärung der Strahlungsdichte eines schwarzen Körpers im Jahr 1900 den Weg für einen neuen Zweig der Physik: die Quantenmechanik. 1918 erhält Planck dann für seine theoretische Erklärung der Strahlungsdichte eines schwarzen Körpers den Nobelpreis. Andererseits formulierte Albert Einstein 1905 die Spezielle Relativitätstheorie (SRT) und 1915 die Allgemeine Relativitätstheorie (ART). Interessanterweise erhielt Einstein jedoch nie den Nobelpreis für seine Relativitätstheorien, sondern stattdessen 1921 für den fotoelektrischen Effekt – ein Werk, das ironischerweise die Grundlage für die Solarindustrie legte und zugleich die Quantenmechanik nachhaltig beeinflusste.
Beide Zweige der Physik führen letztlich zu einem Bruch mit der anschaulichen Vorstellungskraft und dem sogenannten ‚gesunden Menschenverstand‘. In diesem Blog wird die SRT näher betrachtet, denn für ihr Verständnis benötigt man – man mag es kaum glauben – als mathematisches Werkzeug lediglich den guten alten Pythagoras. Zudem lässt sich aus der SRT die wohl berühmteste physikalische Formel überhaupt ableiten: E=mc².
In einem folgenden Blog werde ich auf die Allgemeine Relativitätstheorie (ART) eingehen, dabei jedoch versuchen, die deutlich komplexere Mathematik – insbesondere die Verwendung von Tensoren (mehrdimensionale Operatoren, die partielle Differenzialgleichungen für Energie und Impuls enthalten) – so weit wie möglich außen vorzulassen. Für das Verständnis der ART reicht die Kenntnis des Pythagoras leider nicht mehr aus.
Anschließend folgt eine längere Blogserie zum Thema Quantenmechanik. Wir beginnen mit Plancks Strahlungsdichtegesetz für den schwarzen Körper und seiner Quantisierung der Energie eines harmonischen Oszillators, gefolgt von Einsteins Fotoelektrischem Effekt und dem Doppelspalt-Experiment mit seinen faszinierenden Interpretationen. Und genau in dieser Reihenfolge verabschieden wir uns mit zunehmender Beschleunigung vom ‚gesunden Menschenverstand‘.
Lassen wir uns also auf die physikalische Sicht der Relativität ein. Einstein war ein begeisterter Zugreisender, insbesondere auf den Strecken zwischen Deutschland und der Schweiz. Die Eisenbahn, das technische Wunderwerk seiner Zeit, ermöglichte es vielen Menschen, lange Distanzen in vergleichsweise kurzer Zeit zu überwinden. Kein Wunder also, dass viele seiner berühmten Gedankenexperimente das Zugfahren zum Thema haben.
Ob Einstein mit der heutigen Deutschen Bahn die Relativitätstheorie hätte entwickeln können, bleibt eine offene Frage.
Starten wir also unser Gedankenexperiment:
Es ist Abend, und ich sitze in einem klassischen Zugabteil (kein Großraumabteil), das noch im Bahnhof steht. Ich habe gerade mein Gepäck verstaut und hoffe, dass ich nichts vergessen habe. Glücklicherweise habe ich einen Fensterplatz. Am Nachbargleis steht ebenfalls ein Zug, der auf seine Abfahrt wartet. Während ich mich kurz mit einem Mitreisenden unterhalte, überkommt mich für einen Moment ein seltsames Gefühl.
Sind wir schon losgefahren? Aber das kann nicht sein – das Gefühl der Beschleunigung fehlt. Ich schaue aus dem Fenster und sehe, wie sich die Fenster der beleuchteten Abteile des anderen Zuges aneinander vorbeischieben. Etwas bewegt sich definitiv, aber bin ich es? Mein Zug? Erst ein Blick in die entgegengesetzte Richtung, durch die Tür des Abteils, zeigt mir, dass mein Zug noch immer am Bahnsteig steht und sich nicht vom Fleck bewegt hat. Was ist passiert? Etwas hat sich doch bewegt!
Die Erklärung für dieses Phänomen ist einfach: Das Gehirn kann beim Anblick der sich verschiebenden Zugfenster aufgrund der Bewegung eines Zuges nicht sofort erkennen, welcher Zug sich tatsächlich bewegt. Erst die Erfahrung, dass eine Zugfahrt ohne das leichte Rucken der Beschleunigung nicht begonnen haben kann, weckt Zweifel daran, ob man wirklich losgefahren ist. Deshalb sucht man instinktiv nach einer Bestätigung und schaut auf die andere Seite des Abteils, wo sich die Situation klärt. Die Verwirrung des Gehirns ist also berechtigt – aus einer anderen Perspektive betrachtet, liegt es sogar richtig.
Nun stellen wir uns einen Reisenden im Zug vor, der gerade den Bahnhof verlässt. Er sitzt ebenfalls am Fenster und beobachtet, wie sich der Nachbarzug samt Bahnhof von ihm entfernt. Selbstbewusst legt dieser Reisende ein Koordinatensystem mit dem Ursprung in der Mitte seines Körpers an und stellt fest: Er ruht im Ursprung, während sich der Nachbarzug und der Bahnhof von ihm wegbewegen.
In der folgenden Animation wird der Aspekt der Relativität anschaulich dargestellt. Im ersten Beispiel wird eine Orange von einer Lokomotive, die über eine hohe Eisenbahnbrücke fährt, herabgeworfen. Auf der linken Seite beobachtet jemand von der Lok aus den Wurf und sieht, wie die Orange immer schneller geradewegs in die Tiefe fällt. Genau das würde auch jemand beobachten, der auf der Brücke steht und eine Orange hinunterwirft.
Ganz anders sieht der Wurfverlauf für einen Beobachter aus, der unten steht und die Szene betrachtet. Aus seiner Perspektive beschreibt die Orange eine Wurfparabel. Wie kommt diese zustande? Die Lokomotive und die Orange besitzen einen Impuls m*vZug in Fahrtrichtung des Zuges. Da der Impuls – ähnlich wie die Energie – eine Erhaltungsgröße ist, behält die Orange diesen Impuls auch nach dem Fall bei. Durch das Fallenlassen der Orange geht dieser Impuls nicht verloren. Daher nimmt der ruhende Beobachter eine Überlagerung der horizontalen Bewegung des Zuges und der durch die Gravitation nach unten fallenden Orange wahr.
Relative Bewegung
Der zweite Teil der Animation zeigt eine abstrahierte Darstellung: die ruhende Orange im Zug mit einem Koordinatensystem, dessen Ursprung sich im Mittelpunkt der Orange befindet. Aus dieser Perspektive befindet sich die Orange relativ zu sich selbst in Ruhe. Anders sieht es ein stationärer Beobachter, der durch eine gläserne Front die Orange auf dem Boden des Zuges liegen sieht.
Im dritten Teil der Animation rollt die Orange über den Boden des Zuges. Ein Zuggast nimmt die Orange als rollend, mit einer Geschwindigkeit vOrange wahr. Der stationäre Beobachter von außen hingegen sieht eine Orange, die sich mit der deutlich höheren Geschwindigkeit vOrange + vZug bewegt.
Wie oben angedeutet, verwendet der Physiker unterschiedliche Koordinatensysteme, um die verschiedene Wahrnehmung desselben Vorgangs aus unterschiedlichen Perspektiven zu beschreiben. In den obigen Beispielen wird immer vorausgesetzt, dass es einen ruhenden, stationären Beobachter gibt und relativ zu diesem ein System, das sich mit konstanter Geschwindigkeit, also ohne Beschleunigung, entfernt. Dies ist ein Spezialfall und bildet die Grundlage für die Spezielle Relativitätstheorie.
Kein Geringerer als Galileo Galilei widmete sich diesem Problem und führte das Konzept der sogenannten Galileischen Transformation ein. Dabei beschrieb er ein ruhendes Koordinatensystem mit den kartesischen Koordinaten x, y und z und ein Koordinatensystem, das sich mit konstanter Geschwindigkeit bewegt, mit den Koordinaten x’, y’, z’. Da der gesunde Menschenverstand nahelegt, dass die Zeit absolut ist und nicht vom Koordinatensystem abhängt, gilt für die Zeit t = t’.
Um dies verständlich zu machen, stellen wir uns vor, wir haben zwei Beobachter: einen, der in einem ruhenden Zug sitzt, und einen anderen, der in einem Zug sitzt, der sich mit konstanter Geschwindigkeit bewegt. Der ruhende Beobachter misst die Position eines Objekts im Raum mit den Koordinaten x, y, z. Der Beobachter im bewegenden Zug misst die Position desselben Objekts, aber in seinem eigenen Koordinatensystem, das wir mit x’, y’, z’ bezeichnen.
Die Galileische Transformation beschreibt, wie die Koordinaten in den beiden Systemen zusammenhängen. Wenn wir uns auf eine Bewegung entlang der x-Achse konzentrieren, ist die Transformation ganz einfach:
x’ = x – v * t
Hierbei ist v die konstante Geschwindigkeit, mit der sich der bewegte Zug (das zweite Koordinatensystem) relativ zum ruhenden Zug (dem ersten Koordinatensystem) bewegt. Da die beiden Züge zur gleichen Zeit beobachten, gilt t = t’.
Das bedeutet: Die Position eines Objekts im bewegten System (x’) ist einfach die Position des Objekts im ruhenden System (x) minus dem zurückgelegten Weg des Zuges (v * t). Für die anderen Koordinaten y und z gibt es keine Veränderung, da sie nicht in Bewegungsrichtung liegen: y’ = y und z’ = z.
Diese einfache, intuitive Vorstellung, dass Zeit für beide Beobachter gleich abläuft und dass wir nur die Positionen entlang der Bewegungsrichtung anpassen müssen, bildet die Grundlage für die klassischen, vor-einsteinischen Vorstellungen von Raum und Zeit.
Gegen Ende des 19. Jahrhunderts wurde jedoch immer klarer, dass die Lichtgeschwindigkeit eine besondere Rolle spielt: Sie schien unabhängig von der Bewegung der Erde relativ zur Sonne immer konstant zu bleiben. Dies stellte die klassische Physik vor ein großes Rätsel, da man glaubte, dass Licht wie eine Welle nur durch ein Medium – den sogenannten Äther – übertragen werden könne. Man erwartete, dass die Lichtgeschwindigkeit relativ zur Bewegung der Erde durch den Äther variieren müsste, ähnlich wie die Geschwindigkeit eines Bootes relativ zum Wasserstrom.
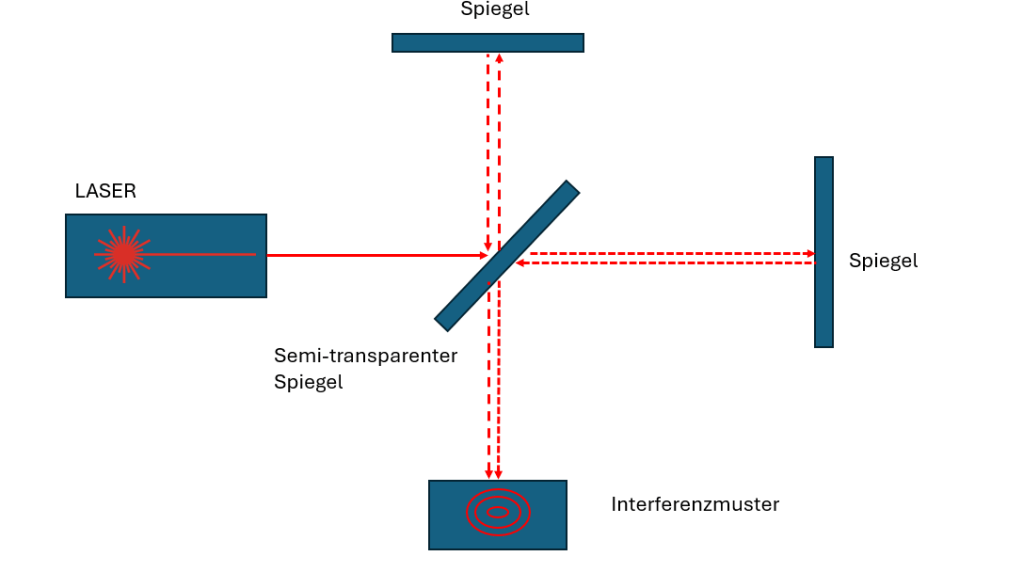
Das berühmte Michelson-Morley-Experiment von 1887 versuchte, diese Veränderung der Lichtgeschwindigkeit zu messen, indem es die Lichtgeschwindigkeit in verschiedene Richtungen auf der Erdoberfläche verglich. Doch zu ihrer Überraschung stellten Michelson und Morley fest, dass die Lichtgeschwindigkeit in allen Richtungen gleich war, unabhängig von der Bewegung der Erde durch den angeblichen Äther. Diese unerwartete Konstanz der Lichtgeschwindigkeit führte zu einem fundamentalen Umdenken in der Physik.
Michelson-Morley Experiment zur Messung der Lichrgeschwindigkeit in “Fahrtrichtung” Erde bzw. Entgegen der Fahrtrichtung Erde (System ist frei rotierbar). Wäre die Lichtgeschwindigkeit abhängig von der Fahrtrichtung der Erde, würden sich die Radien der Interferenzring ändern. Egal wie man das System aber drehte, die Radien der Interferenzringe blieben gleich.
Das Ergebnis des Michelson-Morley-Experiments war einer der entscheidenden Bausteine für die Entwicklung der Speziellen Relativitätstheorie, da es deutlich machte, dass die Lichtgeschwindigkeit eine universelle Konstante ist, die für alle Beobachter gilt – unabhängig davon, wie sie sich bewegen. Diese Erkenntnis zwang die Physiker, die klassischen Vorstellungen von Raum und Zeit radikal zu überdenken.
Die Konstanz der Lichtgeschwindigkeit in allen Bezugssystemen stellt ein Problem für die Galileische Transformation dar, weil sie den grundlegenden Annahmen widerspricht, auf denen die Galileische Transformation beruht.
Um das anschaulich zu erklären, stellen wir uns zunächst einmal die Grundidee der Galileischen Transformation vor: Diese Transformation geht davon aus, dass die Zeit in allen Bezugssystemen absolut ist, das heißt, sie läuft für alle Beobachter gleich ab. Wenn wir uns also in einem fahrenden Zug befinden und ein Objekt im Zug werfen, würde die Geschwindigkeit des Objekts in Bezug auf einen außenstehenden, ruhenden Beobachter einfach die Geschwindigkeit des Objekts relativ zum Zug plus die Geschwindigkeit des Zuges selbst sein. Das ist intuitiv und entspricht unserem Alltagsverständnis.
Jetzt kommt aber das Licht ins Spiel. Nehmen wir an, dass im Zug eine Taschenlampe eingeschaltet wird und ein Lichtstrahl nach vorn ausgesendet wird. Laut der klassischen Physik (und damit auch der Galileischen Transformation) müsste die Geschwindigkeit dieses Lichtstrahls aus Sicht eines außenstehenden Beobachters ebenfalls die Geschwindigkeit des Lichtstrahls relativ zum Zug plus die Geschwindigkeit des Zuges selbst sein – genau wie bei dem geworfenen Objekt.
Das Problem tritt jedoch auf, weil Experimente gezeigt haben, dass das Licht sich für alle Beobachter immer mit derselben Geschwindigkeit bewegt – unabhängig davon, wie schnell sich der Zug oder das Licht relativ zum Zug bewegt. Das bedeutet, ob der Zug fährt oder nicht, jeder Beobachter misst für das Licht immer dieselbe Geschwindigkeit, nämlich etwa 300.000 Kilometer pro Sekunde.
Stellen wir uns vor, dass ein Außenstehender die Geschwindigkeit des Lichtes im Vergleich zum Zug messen möchte. Nach der Galileischen Transformation müsste er eigentlich feststellen, dass das Licht, das vom Zug ausgestrahlt wird, schneller oder langsamer ist, je nachdem, ob der Zug auf ihn zu- oder von ihm wegfährt. Doch das passiert nicht. Die Messungen zeigen, dass die Lichtgeschwindigkeit unabhängig von der Bewegung des Zuges konstant bleibt.
Das bedeutet, die Annahme der Galileischen Transformation – dass sich Geschwindigkeiten einfach addieren – funktioniert für Licht nicht. Denn wenn die Lichtgeschwindigkeit konstant bleibt, kann die Geschwindigkeit des Zuges nicht einfach auf die Lichtgeschwindigkeit „draufgepackt“ werden. Diese Diskrepanz bedeutet, dass das klassische Konzept von Raum und Zeit, wie es durch die Galileische Transformation beschrieben wird, nicht ausreicht, um die Realität zu erklären.
Um dieses Problem zu lösen, musste Albert Einstein eine völlig neue Art des Denkens einführen: die Spezielle Relativitätstheorie. In dieser Theorie wird die Konstanz der Lichtgeschwindigkeit als fundamentales Prinzip anerkannt, und daraus folgt, dass Raum und Zeit nicht absolut sind, sondern relativ – sie verändern sich je nach dem Bewegungszustand des Beobachters. Dies führte zu der revolutionären Erkenntnis, dass Zeit und Raum miteinander verknüpft sind und dass Zeit für verschiedene Beobachter unterschiedlich verlaufen kann, abhängig von ihrer relativen Geschwindigkeit.
Kurz gesagt: Die Konstanz der Lichtgeschwindigkeit widerspricht der Vorstellung, dass man Geschwindigkeiten einfach addieren kann, wie es in der Galileischen Transformation vorgesehen ist, und zeigt, dass unsere herkömmlichen Vorstellungen von Raum und Zeit überdacht werden müssen.
Schauen wir uns das aber noch einmal auf der Formel Ebene an.
Um zu demonstrieren, dass die Galileische Transformation nur gerettet werden kann, wenn man annimmt, dass t ≠ t’ (also die Zeit in den beiden Bezugssystemen unterschiedlich ist), gehen wir durch ein Gedankenexperiment, das die Probleme mit der Annahme von t = t’ verdeutlicht.
Ausgangssituation
Nehmen wir an, wir haben zwei Beobachter:
Beobachter A ist in einem ruhenden Bezugssystem (z.B. steht auf dem Bahnsteig).
Beobachter B ist in einem bewegten Bezugssystem (z.B. sitzt in einem Zug, der mit konstanter Geschwindigkeit v nach rechts fährt).
Jetzt senden wir einen Lichtstrahl von der Spitze des Zuges in Fahrtrichtung (nach rechts). Laut der klassischen Physik, die die Galileische Transformation nutzt, sollte die Geschwindigkeit des Lichts aus Sicht von Beobachter A die Geschwindigkeit des Lichts c plus die Geschwindigkeit des Zuges vsein. Aus Sicht von Beobachter B, der sich mit dem Zug bewegt, sollte das Licht einfach die Geschwindigkeit c haben, weil es relativ zu ihm ausgesendet wird.
Galileische Transformation mit t = t’
Die Galileische Transformation geht davon aus, dass die Zeit für beide Beobachter gleich ist, also t=t′. Dies führt zu folgender Formel für die Position x′ des Lichtstrahls relativ zu Beobachter B im Zug:
x′=x−vt
Nehmen wir an, das Licht bewegt sich im ruhenden System (aus Sicht von Beobachter A) mit einer Geschwindigkeit c fort. Dann wäre: x=ct
Einsetzen in die Galileische Transformation:
x′=ct−vt
x′=t(c−v)
Diese Formel bedeutet, dass das Licht für Beobachter B mit einer geringeren Geschwindigkeit c−v erscheint, was dem Prinzip widerspricht, dass die Lichtgeschwindigkeit in allen Bezugssystemen gleich c sein sollte. Hier zeigt sich das Problem der Annahme t=t′
Anpassung der Transformation: t ≠ t’
Um die Konstanz der Lichtgeschwindigkeit zu retten, müssen wir annehmen, dass die Zeit in den beiden Bezugssystemen unterschiedlich verläuft. Dies führt zu der Idee, dass die Zeit für Beobachter B langsamer oder schneller verlaufen muss, je nachdem, wie er sich relativ zu Beobachter A bewegt. Das bedeutet, dass t und t′ nicht gleich sein dürfen.
Wir müssen also die Zeit in das Transformationsgesetz einbeziehen. Statt einfach t=t′ anzunehmen, postulieren wir, dass t und t′ durch eine Funktion miteinander verbunden sind, die von der Relativgeschwindigkeit abhängt.
Diese Funktion wird in der Physik Gammafaktor bzw. Lorentzfaktor genannt, nach dem niederländischen Mathematiker Hendrik Antoon Lorentz, der als erste diese Beziehung aufstellte, aber die physikalische Interpretation doch lieber Einstein überließ, zu gewagt schien sie ihm.
Und jetzt kommt endlich die Stunde des Pythagoras.
Um den Lorentzfaktor herzuleiten, verwenden wir ein Gedankenexperiment mit einer sogenannten „Lichtuhr“ und den Satz des Pythagoras. Dieses Experiment hilft uns, die Auswirkungen der speziellen Relativitätstheorie und die Rolle des Lorentzfaktors verständlich zu machen.
Was ist eine Lichtuhr?
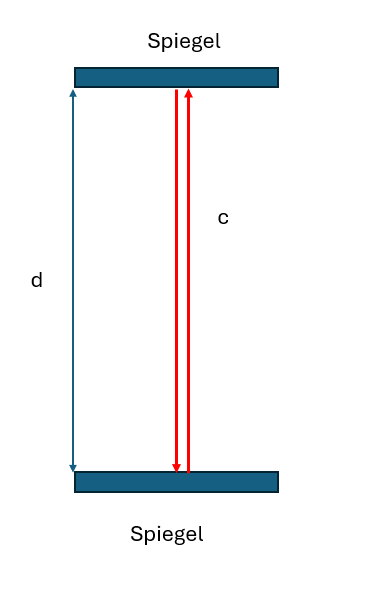
Stell dir eine Lichtuhr als einfaches Gerät vor, das aus zwei parallelen Spiegeln besteht, die sich in einem bestimmten Abstand voneinander befinden. Ein Lichtstrahl wird zwischen diesen beiden Spiegeln hin- und her reflektiert. Jedes Mal, wenn der Lichtstrahl den oberen Spiegel erreicht und wieder zurückgeworfen wird, vergeht eine bestimmte Zeitspanne – nennen wir sie „Tick“.
Lichtuhr mit zwei gegenüberliegenden Spiegeln mit Abstand d
Die Lichtuhr in einem bewegten Bezugssystem
Zunächst betrachten wir die Lichtuhr in einem bewegten Bezugssystem. Ein Zugfahrer hat die Uhr mit in den Zug genommen. Aus Sicht eines Beobachters, der sich relativ zur Lichtuhr nicht bewegt, aber selbst mit dem Zug fährt, bewegt sich der Lichtstrahl mit der Lichtgeschwindigkeit c senkrecht zwischen den Spiegeln hin und her.
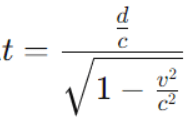
Wenn der Abstand zwischen den Spiegeln d beträgt, dann ist die Zeit, die das Licht benötigt, um von einem Spiegel zum anderen zu gelangen:
t’=d/c
Hier ist t’ die Zeit, die in einem bewegtem System für einen „Tick“ der Uhr gemessen wird.
Die Lichtuhr aus Sicht eines ruhenden Bezugssystems
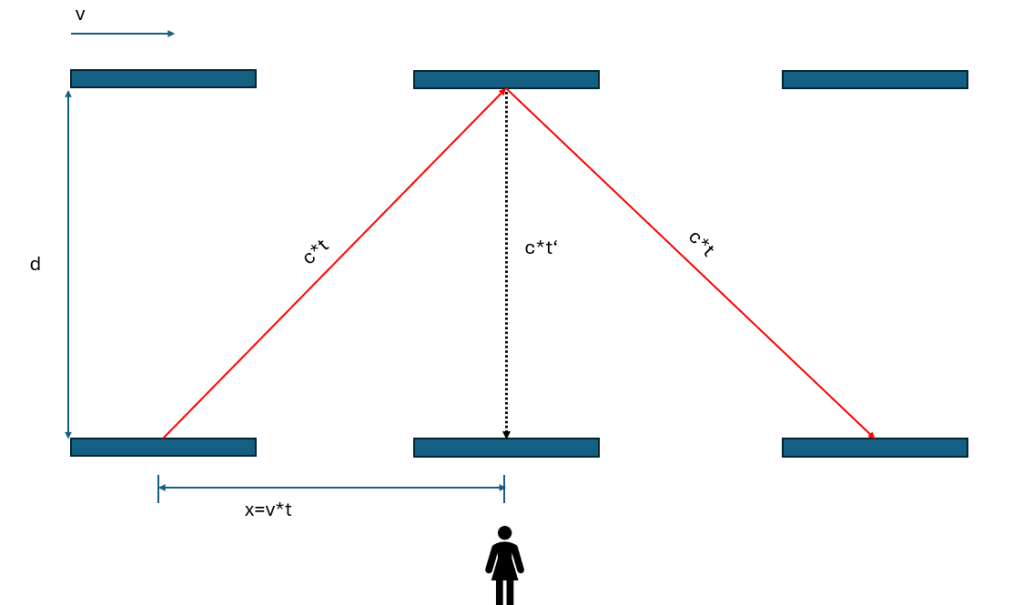
Jetzt stellen wir uns vor, dass die Lichtuhr mit einer konstanten Geschwindigkeit v relativ zu einem Beobachter in horizontaler Richtung (z.B. nach rechts) bewegt wird.
Lichuhr beobachtet von einer ruhenden Beobachterin. Grafik übernommen aus Kapitel 5: Spezielle Relativitätstheorie des Buches ‘Können wir die Welt verstehen’.
Aus Sicht dieses ruhenden Beobachters macht der Lichtstrahl nicht nur eine senkrechte Bewegung (zwischen den Spiegeln), sondern auch eine horizontale Bewegung (aufgrund der Bewegung der Lichtuhr). Diese horizontale Bewegung bedeutet, dass das Licht, um den oberen Spiegel zu erreichen, eine längere Strecke zurücklegen muss, die eine diagonale Linie bildet.
Herleitung des Lorentzfaktors mit dem Satz des Pythagoras
Um die Strecke, die das Licht in der bewegten Uhr (aus Sicht der Beobachterin am Bahnsteig) zurücklegt, zu berechnen, können wir den Satz des Pythagoras verwenden.
Strecke, die das Licht in vertikaler Richtung zurücklegt: Diese Strecke ist gleich dem Abstand zwischen den Spiegeln, also d.
Strecke, die das Licht in horizontaler Richtung zurücklegt: Während das Licht sich von einem Spiegel zum anderen bewegt, hat sich die Uhr auch um eine horizontale Strecke v*t bewegt, wobei t die Zeit ist, die für einen „Tick“ in diesem ruhenden System benötigt wird.
Gesamte Strecke (Hypotenuse): Die gesamte Strecke s, die das Licht in der bewegten Uhr zurücklegt, bildet die Hypotenuse eines rechtwinkligen Dreiecks, mit d als einer Kathete und v*t als der anderen Kathete. Laut dem Satz des Pythagoras gilt:
s2=d2+(v*t)2
Da das Licht sich immer mit der Geschwindigkeit c bewegt, ist die Strecke s gleich:
s=c*t
Setzen wir das in die Pythagoras-Gleichung ein:
(c*t)2=d2+(v*t)2
Teilen wir die gesamte Gleichung durch c2:
t2=d2/c2+ v2*t2 / c2
Jetzt ziehen wir den Term (v2*t2)/c2 auf die linke Seite:
t2(1−v2/c2)=d2/c2
Nun isolieren wir t:
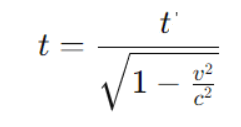
Wir wissen, dass d/c die Zeit t’ ist, die der bewegte Beobachter misst. Damit ergibt sich:
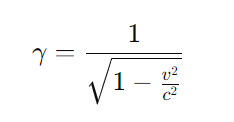
Wobei der Lorentzfaktor γ ist gegeben durch:
Damit können wir die Zeitdilatation beschreiben: t=γ*t’
Interpretation
Zeitdilatation: Die Zeit t’, die in einem bewegten System vergeht, ist kürzer als die Zeit t, die in einem ruhenden System vergeht. Das bedeutet, dass eine Uhr, die sich bewegt, langsamer tickt, wenn sie von einem ruhenden Beobachter betrachtet wird.
Der Lorentzfaktor γ: Der Faktor γ beschreibt, wie stark die Zeit gedehnt wird (=langsamer tickt), je schneller sich das Bezugssystem bewegt. Je näher die Geschwindigkeit v der Lichtgeschwindigkeit c kommt, desto größer wird γ und desto stärker ist die Zeitdilatation.
Ich bin mir sicher, dass die allermeisten trotz des Einsatzes überschaubarer Mathematik (Pythagoras) doch ziemlich skeptisch bleiben. Die Aussage ist, dass bei jemandem, der sich bewegt, die Zeit langsamer abläuft (langsamer tickt) als bei jemandem in Ruhe. Ich bin in meinem Leben oft hektisch hin und her gelaufen, danach fühlte ich mich meistens eher älter als jünger. Und überhaupt, wer hat schon so eine Lichtuhr, typisch Physiker wissen halt nicht eine gute Uhr aus rotierenden Zeigern zu benutzen. Allmählich versteht man, dass Einstein dafür keinen Nobelpreis bekommen hat. Der Hack mit dem Pythagoras ist doch ein Taschenspielertrick?
Nähern wir uns dem Problem der unterschiedlichen Zeiten noch mal von der Physik ohne Mathematik.
Der Unterschied zwischen dem Wurf einer Orange innerhalb eines fahrenden Zuges und dem Einschalten einer Taschenlampe im Zug lässt sich durch die unterschiedlichen Gesetze erklären, die für klassische Objekte (wie die Orange) und Licht (Photonen) gelten.
Wurf einer Orange im fahrenden Zug
Wenn du eine Orange innerhalb eines fahrenden Zuges wirfst, bewegt sich die Orange mit einer Geschwindigkeit, die sich aus zwei Komponenten zusammensetzt:
Geschwindigkeit des Zuges: Der Zug bewegt sich relativ zum Bahnsteig mit einer bestimmten Geschwindigkeit vZug
Wurfgeschwindigkeit: Du wirfst die Orange relativ zu dir (und damit relativ zum Zug) mit einer bestimmten Geschwindigkeit vWurf.
Nach den Gesetzen der klassischen Physik, genauer gesagt nach der Galileischen Transformation, addieren sich diese beiden Geschwindigkeiten. Wenn also ein Beobachter auf dem Bahnsteig steht, sieht er die Orange mit einer Gesamtgeschwindigkeit von vGesamt=vZug+vWurf auf sich zukommen.
Der Impuls der Orange, der das Produkt aus ihrer Masse und ihrer Geschwindigkeit ist, wird ebenfalls durch diese Gesamtgeschwindigkeit bestimmt: pOrange = mOrange*(vZug+vWurf)
Licht im Zug
Nun betrachten wir das Einschalten einer Taschenlampe im selben fahrenden Zug. Wenn du die Taschenlampe anmachst, sendet sie Photonen (Lichtteilchen) aus. Nach den Erkenntnissen der modernen Physik, insbesondere der Speziellen Relativitätstheorie, bewegt sich Licht immer mit der gleichen Geschwindigkeit c – unabhängig davon, ob der Zug fährt oder steht.
Wichtige Unterschiede:
Geschwindigkeit des Lichts: Das entscheidende Merkmal von Licht ist, dass seine Geschwindigkeit c unabhängig von der Geschwindigkeit des Zuges ist. Ob der Zug fährt oder steht, ein außenstehender Beobachter misst immer dieselbe Lichtgeschwindigkeit c. Das bedeutet, dass die Geschwindigkeit des Zuges keinerlei Einfluss auf die Geschwindigkeit des Lichts hat. Im Gegensatz zur Orange addiert sich die Geschwindigkeit des Zuges nicht zur Lichtgeschwindigkeit.
Impuls des Photons: Ein Photon hat einen Impuls, der durch seine Energie bestimmt ist (nach p=E/c), aber dieser Impuls hängt nicht von der Geschwindigkeit des Zuges ab. Das Licht erhält keinen zusätzlichen Impuls durch die Bewegung des Zuges. Es hat immer denselben Impuls, unabhängig davon, ob es im fahrenden Zug oder im stehenden Zug erzeugt wird.
Relativität und Universum: Während die Orange sich relativ zum Zug und zum Bahnsteig bewegt und ihre Geschwindigkeit in unterschiedlichen Bezugssystemen anders wahrgenommen wird, ist das Licht „relativ“ zum gesamten Universum unterwegs. Die Lichtgeschwindigkeit ist in jedem Bezugssystem, egal, wie schnell sich das Bezugssystem bewegt, immer gleich. Das ist ein fundamentaler Unterschied, der die klassische Physik (wie bei der Orange) von der Relativitätstheorie unterscheidet.
Klassische Objekte und Licht als Elementarteilchen funktionieren nach unterschiedlichen Regeln und daher machte die Spezielle Relativitätstheorie eine Anpassung der klassischen Konzepte von Raum, Zeit und Bewegung erforderlich.
Aber warum kann man denn davon als normal Sterblicher nichts, aber auch gar nichts merken, schließlich rasen wir doch tagtäglich um “unseren” Globus?
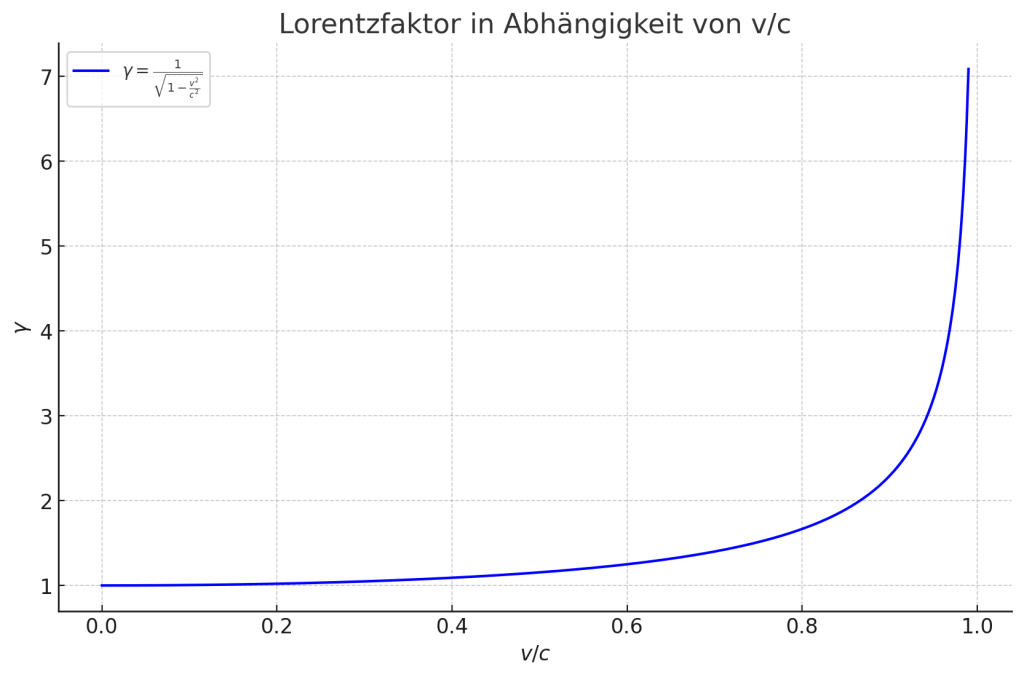
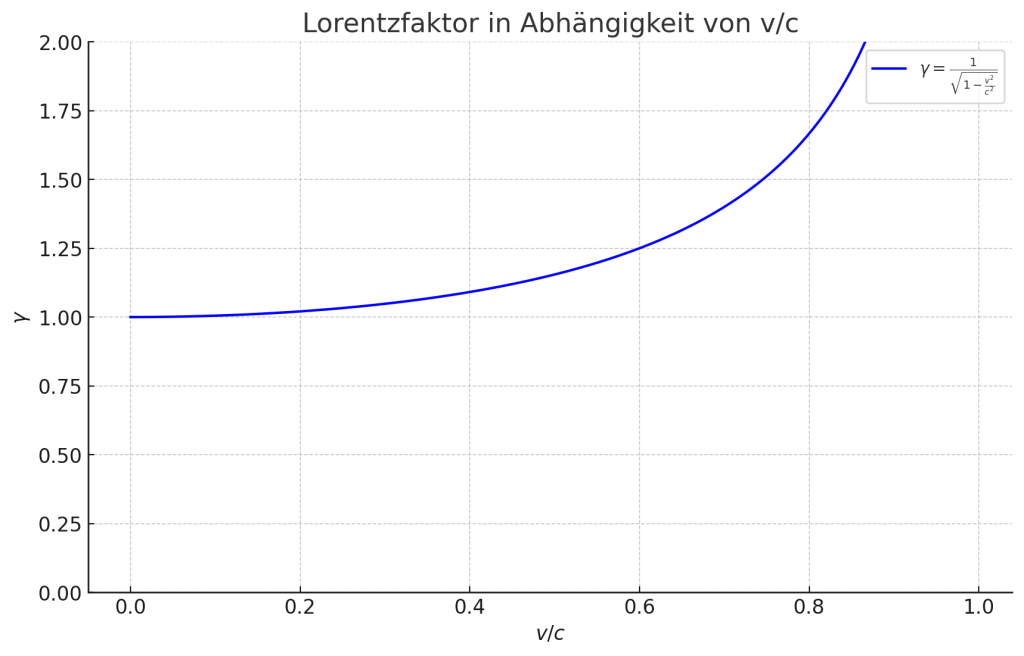
Dazu muss man sich ebendiesen γ Faktor mal ansehen:
γ Faktor in Abhängigkeit der Relativgeschwindigkeit v/c
An diesem Diagramm kann man sehen, dass ungefähr ab v>=20 % c der Lichtgeschwindigkeit der γ Faktor etwas von der eins “abhebt“. Schauen wir uns diesen Bereich noch mal genauer an:
γ Faktor in Abhängigkeit der Relativgeschwindigkeit v/c
Man sieht auch bei v=20%c ist der γ Faktor weiterhin nicht sehr viel größer als 1. Und da wir normal Sterblichen uns auf diesem Planeten mit weit unter v=20%c bewegen, gilt für uns in ausgezeichneter Näherung γ=1 und damit ist t=t’.
Erst 1971 haben die Astronomen Joseph C. Hafele und der Astronom Richard E. Keating die Spezielle Relativitätstheorieexperimentell bestätigt und dazu haben sie auch einigen Aufwand betrieben. Sie bestiegen, mit vier Atomuhren, ein Linienflugzeug und umrundeten damit die Erde je zweimal, zuerst in östlicher, dann in westlicher Richtung. Der Nobelpreis wäre Einstein nun sicher gewesen, aber da war er leider schon 16 Jahre tot und postum wird kein Nobelpreis verliehen.
Hat die Relativitätstheorie denn für uns überhaupt eine Relevanz? Die Antwort ist eindeutig Ja.
In der Allgemeinen Relativitätstheorie, die Einstein 1915 veröffentlichte, begründete er aus der Theorie, also entsprungen aus seinen unnachahmlichen Gedankenexperimenten, dass auch die Gravitation einen Einfluss auf die Zeit hat. In Kurzform ist eine Aussage der ART, dass je weiter man von einem Gravitationszentrum ist, umso schneller die Zeit vergeht. Der Almöhi altert also schneller als die Niederrheiner.
Und es gibt heute ein sehr wesentliches Werkzeug, das ohne SRT und ART nicht wirklich gut funktionieren würde: Das GPS System.
Das GPS-System (Global Positioning System) ist ein beeindruckendes Beispiel dafür, wie die spezielle und Allgemeine Relativitätstheorie in der Praxis angewendet werden, um präzise Ortsmessungen auf der Erde durchzuführen. Obwohl es auf den ersten Blick so aussieht, als ob GPS einfach nur Entfernungen misst, basiert das System tatsächlich auf sehr genauen Zeitmessungen. Welche Rolle spielen die beiden Theorien beim GPS?
Grundprinzip des GPS
Das GPS funktioniert, indem es die Position eines Empfängers (z. B. Ihr Smartphone) auf der Erde berechnet, indem es Signale von mehreren Satelliten empfängt. Jeder Satellit sendet kontinuierlich ein Signal aus, das die genaue Zeit, zu der es gesendet wurde, und die Position des Satelliten zum Zeitpunkt des Sendens enthält.
Ihr GPS-Empfänger nimmt diese Signale auf und berechnet die Zeit, die jedes Signal benötigt hat, um den Empfänger zu erreichen. Da das Signal mit Lichtgeschwindigkeit reist, kann der Empfänger die Entfernung zu jedem Satelliten berechnen, indem er die Zeit mit der Lichtgeschwindigkeit multipliziert. Mit mindestens vier Satelliten kann der Empfänger seine genaue Position auf der Erde bestimmen.
Warum Zeitmessung so wichtig ist
Die Genauigkeit der Ortsbestimmung im GPS hängt von der extrem präzisen Zeitmessung ab. Selbst ein winziger Fehler von einer Milliardstel Sekunde (1 Nanosekunde) in der Zeitmessung kann zu einem Positionsfehler von mehreren Metern führen. Deshalb müssen die Uhren in den GPS-Satelliten extrem genau sein, und hier kommen die relativistischen Effekte ins Spiel.
Relativistische Effekte und das GPS
Es gibt zwei Hauptaspekte der Relativitätstheorie, die das GPS betreffen:
Spezielle Relativitätstheorie (SRT):
Die spezielle Relativitätstheorie sagt voraus, dass bewegte Uhren langsamer gehen, verglichen mit Uhren in einem ruhenden Bezugssystem. Die Satelliten bewegen sich mit einer sehr hohen Geschwindigkeit um die Erde (ungefähr 14.000 Kilometer pro Stunde).
Wegen dieser hohen Geschwindigkeit ticken die Uhren an Bord der Satelliten langsamer als Uhren auf der Erde. Dieser Effekt ist klein, aber messbar: Die Uhren der Satelliten gehen etwa 7 Mikrosekunden (Millionstel Sekunden) pro Tag langsamer als die Uhren auf der Erde.
Allgemeine Relativitätstheorie (ART):
Die Allgemeine Relativitätstheorie sagt voraus, dass Uhren in einem stärkeren Gravitationsfeld langsamer gehen. Die Erde erzeugt ein starkes Gravitationsfeld, das auf der Erdoberfläche stärker ist als in der Höhe, in der die GPS-Satelliten kreisen (etwa 20.000 Kilometer über der Erde).
In der Höhe der Satelliten ist die Schwerkraft schwächer, und daher laufen die Uhren der Satelliten schneller als Uhren auf der Erdoberfläche. Dieser Effekt ist etwas größer als der speziellen Relativitätstheorie: Die Uhren in den Satelliten laufen etwa 45 Mikrosekunden pro Tag schneller.
Korrektur der relativistischen Effekte
Wenn man die Effekte der speziellen und Allgemeinen Relativitätstheorie kombiniert, ergibt sich, dass die Uhren der GPS-Satelliten etwa 38 Mikrosekunden (45 – 7 = 38) pro Tag schneller gehen als Uhren auf der Erdoberfläche.
Dieser Unterschied von 38 Mikrosekunden pro Tag mag klein erscheinen, aber ohne Korrektur würde er zu einem enormen Positionsfehler führen – etwa 10 Kilometer pro Tag! Deshalb wird der Unterschied durch spezielle Korrekturen im GPS-System berücksichtigt:
Vorstartkalibrierung: Bevor die Satelliten ins All geschickt werden, werden ihre Atomuhren so eingestellt, dass sie auf der Erde etwas langsamer laufen. Sobald sie im Orbit sind und die relativistischen Effekte wirksam werden, laufen die Uhren im Weltraum mit der korrekten Geschwindigkeit, sodass sie mit den Uhren auf der Erde synchron bleiben.
Kontinuierliche Anpassungen: Die Bodenstationen des GPS-Systems überwachen kontinuierlich die Uhren in den Satelliten und nehmen gegebenenfalls kleinere Anpassungen vor, um sicherzustellen, dass die Zeitmessungen extrem genau bleiben.
Ohne Einstein würde meine Generation wohl noch ihren “geliebten” Falk Plan nutzen.
Aber es gibt noch einen viel tiefer gehenden Grund, warum die Relativitätstheorie uns alles andere als egal sein sollte.
Das Prinzip von Ursache und Wirkung ist eine grundlegende Idee in der Physik: Eine Ursache (z. B. das Schieben eines Balls) führt zu einer Wirkung (z. B. das Rollen des Balls). Dieses Prinzip setzt voraus, dass die Reihenfolge von Ereignissen in allen Bezugssystemen – also für alle Beobachter, unabhängig davon, wie sie sich bewegen – gleich bleibt. Damit dieses Prinzip universell gilt, muss die Lichtgeschwindigkeit in allen Bezugssystemen konstant sein.
Ursache und Wirkung
Das Prinzip von Ursache und Wirkung setzt voraus, dass die Reihenfolge von Ereignissen – also, dass die Ursache immer vor der Wirkung kommt – für alle Beobachter gleich bleibt.
Stellen Sie sich vor, dass die Lichtgeschwindigkeit nicht konstant wäre. Wenn eine Ursache (z. B. das Einschalten einer Lampe) ein Ereignis auslöst (z. B. das Erscheinen eines Lichtstrahls), könnten unterschiedliche Beobachter die Reihenfolge dieser Ereignisse anders wahrnehmen. In einem System, in dem die Lichtgeschwindigkeit nicht konstant ist, könnte es sein, dass ein Beobachter sieht, dass der Lichtstrahlzuerst erscheintund dann die Lampe eingeschaltet wird. Das würde das Prinzip von Ursache und Wirkung verletzen, weil die Wirkung (das Licht) vor der Ursache (dem Einschalten) eintreten würde.
Das Problem ohne konstante Lichtgeschwindigkeit
Wenn die Lichtgeschwindigkeit nicht konstant wäre:
Unterschiedliche Beobachter könnten widersprüchliche Abfolgen von Ereignissen wahrnehmen. Ein Beobachter könnte sehen, dass A passiert, bevor B passiert, während ein anderer Beobachter sieht, dass B vor A passiert. Das würde die Grundlage unserer physikalischen Gesetze untergraben, die auf einer konsistenten Kausalität basieren.
Die Kausalität wäre nicht mehr gesichert. Ereignisse könnten in einer Weise wahrgenommen werden, dass Wirkungen vor ihren Ursachen eintreten, was physikalisch unmöglich ist.
Wie die Konstanz der Lichtgeschwindigkeit das Prinzip bewahrt
Die Konstanz der Lichtgeschwindigkeit stellt sicher, dass die Gesetze der Physik, einschließlich des Prinzips von Ursache und Wirkung, für alle Beobachter in allen Bezugssystemen gleich bleiben. Sie zwingt die Natur dazu, Raum und Zeit so zu „verbiegen“, dass die Reihenfolge von Ereignissen konsistent bleibt und Kausalität (also das Prinzip, dass Ursachen immer Wirkungen vorausgehen) für alle gewährleistet ist.
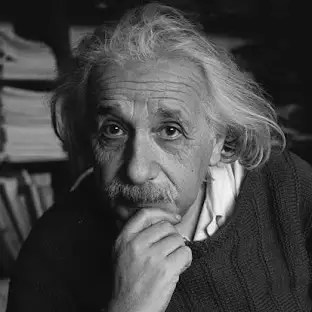
Beenden möchte ich diesen Blog natürlich mit Albert Einstein:
„Das Unbegreiflichste an der Welt ist, dass sie begreiflich ist.“
…und SRT und ART sind essenzielle Bausteine, sie “begreiflich” zu machen.
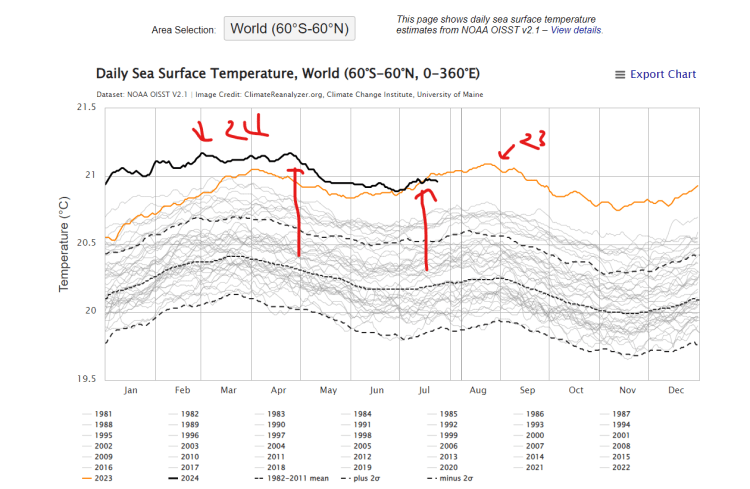
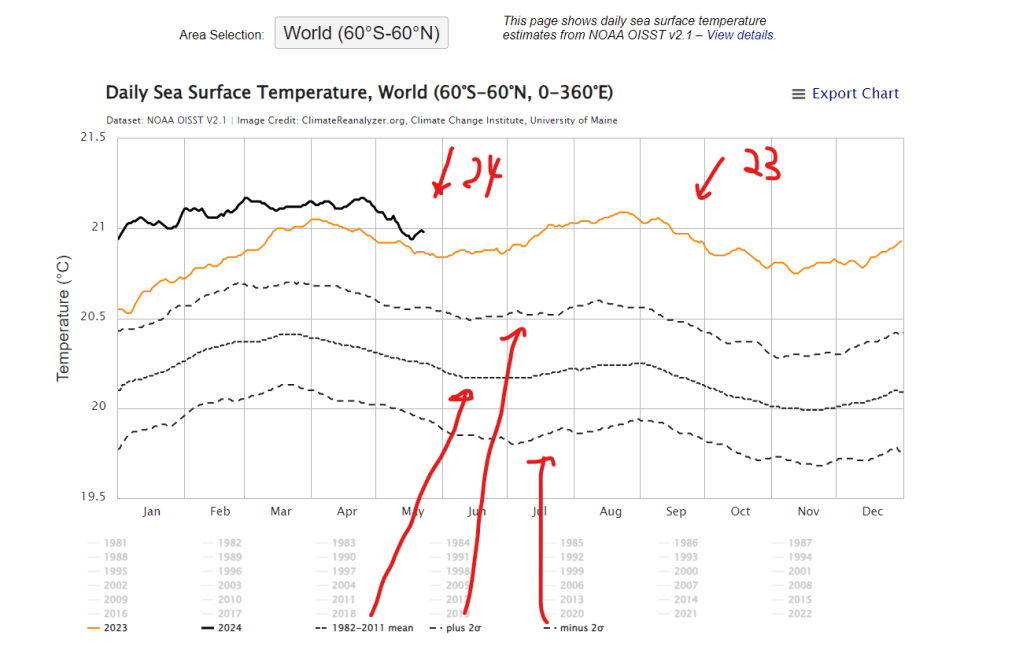
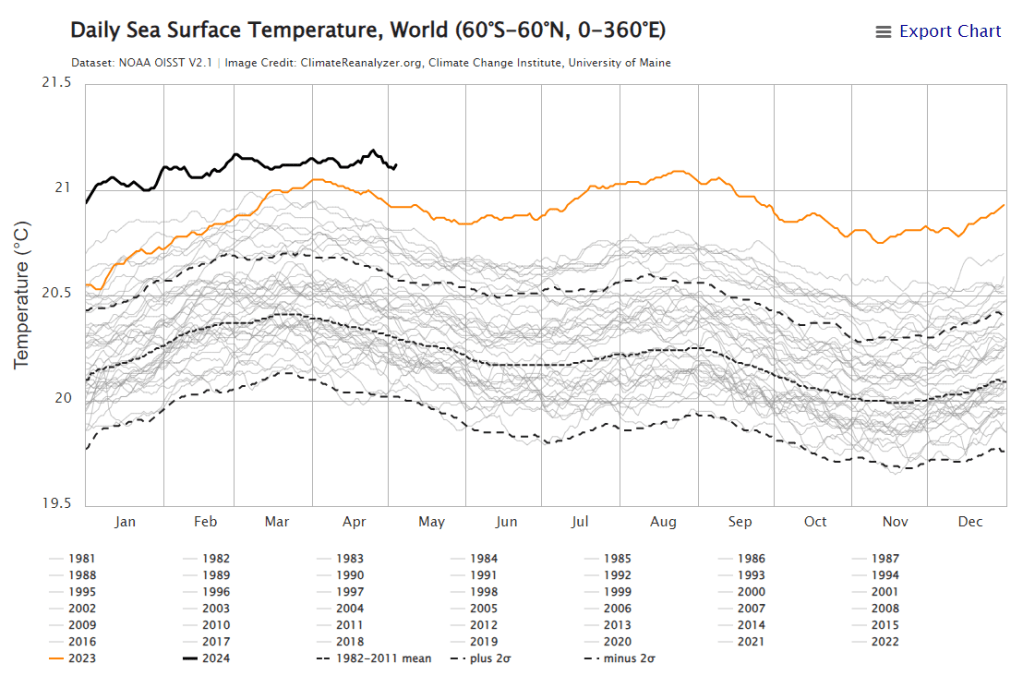
In meinem Blog “Der Faktor Mensch” habe ich darauf hingewiesen, dass möglicherweise bereits ein Kippen des Klimas zu beobachten ist. Besonders auffällig ist die sprunghafte Erhöhung der Oberflächentemperatur der Ozeane:
Die Universität Maine (USA) visualisiert Meeresdaten, die von der amerikanischen Ozeanografiebehörde NOAA zur Verfügung gestellt werden. Die zweite gestrichelte Linie von unten zeigt die mittlere Meeresoberflächentemperatur von 60° Süd bis 60° Nord, bezogen auf die Referenzperiode 1982–2011. Im Jahr 2023 (ein El Niño-Jahr – orange Linie) stieg die Meeresoberflächentemperatur sprunghaft über die 2-Sigma-Grenze des langjährigen Mittels der Referenzperiode. In der Messtechnik bedeutet eine derartig große Abweichung, dass die Wahrscheinlichkeit, dass diese Veränderung zufällig ist, unter 5 % liegt. Mit einer Wahrscheinlichkeit von 95 % hat eine kausale Veränderung diese Abweichung verursacht. Was könnten solche Ursachen sein? Einerseits wird El Niño angeführt, andererseits auch die sauberere Luft aufgrund verschärfter Umweltnormen, die zu weniger Aerosolen führt – was zwar gut ist –, aber Aerosole haben eine kühlende Wirkung.
Im folgenden Interview:
erklärt Dr. Stephanie Rowe, die Global Climate and Energy Lead Scientist des WWF, dass die extremen Hitzerekorde, die weltweit aufgestellt werden, und ihre Auswirkungen auf unser Verständnis des Klimawandels, Anlass zur Sorge geben. Dr. Rowe betont, dass diese Hitzewellen zwar den Vorhersagen des Klimawandels entsprechen, das Ausmaß und die Intensität der Erwärmung jedoch die Erwartungen übertroffen haben, insbesondere bei den Temperaturen an Land und im Ozean. Diese beispiellose Erwärmung hat Bedenken ausgelöst, dass sich das Klimasystem schneller verändern könnte, als die Modelle vorhergesagt haben.
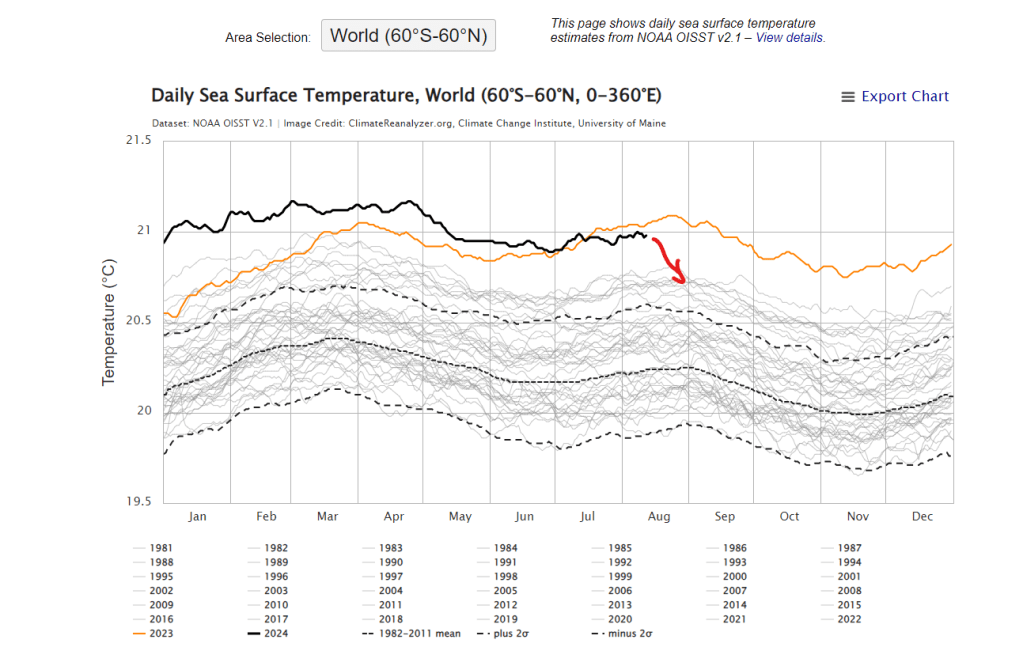
Ein entscheidender Punkt für die Bewertung der oben genannten Temperaturanomalie könnte sich bereits Ende August 2024 abzeichnen, wenn der erwartete Übergang von El Niño- zu La Niña-Bedingungen stattfinden sollte, die typischerweise die globalen Temperaturen kühlen.
Dr. Rowe verweist auf einen Artikel von Gavin Schmidt, dem Direktor des NASA Goddard-Instituts, der besagt, dass, wenn sich die Temperaturanomalien bis Ende August trotz des erwarteten Kühlungseinflusses von La Niña nicht stabilisieren, dies darauf hindeuten könnte, dass sich das Klimasystem schneller verändert hat als angenommen. Dies würde darauf hinweisen, dass unser derzeitiges Verständnis und die Klimamodelle die Geschwindigkeit und Schwere des Klimawandels unterschätzen, was uns in „unbekanntes Gebiet“ führen würde, in dem das Klimasystem, wie wir es kennen, viel früher als erwartet grundlegend verändert werden könnte. Diese Möglichkeit unterstreicht die dringende Notwendigkeit für entschlossenere Klimaschutzmaßnahmen.
Die Hoffnung ist, dass sich mit dem Einsetzen der La Niña-Phase im Pazifik die Oberflächentemperatur der Meere bis Ende August in diese Richtung bewegt.
Sollte sich die Meeresoberflächentemperatur jedoch weiterhin auf dem Niveau der orangen Linie von 2023 entwickeln, hätten wir ein ernstes Problem.
Warum würde eine fehlende Abkühlung im August auf einen verstärkten, schnelleren Klimawandel hindeuten?
Wenn bis Ende August kein signifikantes Abkühlungssignal beobachtet wird, könnte dies darauf hindeuten, dass der typische Austausch zwischen den wärmeren oberen Ozeanschichten und den kühleren tieferen Schichten gestört ist. Dieses Phänomen könnte mit einer zunehmenden Schichtung des Ozeans in Verbindung stehen, bei der sich ein stärker ausgeprägter Temperaturunterschied zwischen der Oberfläche und den tieferen Wasserschichten entwickelt.
Diese verstärkte Schichtung ist ein Symptom des Klimawandels. Mit steigenden globalen Temperaturen erwärmen sich die Oberflächengewässer des Ozeans schneller als die tieferen Schichten. Wärmeres Wasser ist weniger dicht und bleibt daher an der Oberfläche, was die Durchmischung mit kälterem, tieferem Wasser verringert. Diese reduzierte Durchmischung kann mehrere Konsequenzen haben:
Erhöhte Oberflächentemperaturen: Der Mangel an Durchmischung führt dazu, dass die Wärme in den oberen Schichten des Ozeans eingeschlossen bleibt, was zu höheren Oberflächentemperaturen führt.
Gestörte Meeresströmungen: Meeresströmungen, die auf Temperaturgradienten angewiesen sind, könnten verändert werden, was globale Klimamuster beeinflussen könnte.
Weniger Nährstoffauftrieb: Die tieferen Wasserschichten bringen normalerweise Nährstoffe nach oben, die das Meeresleben unterstützen. Eine reduzierte Durchmischung kann zu einem Rückgang dieser Nährstoffe führen, was die marinen Ökosysteme beeinträchtigt.
Sauerstoffgehalt im Ozean: Ein stärker geschichteter Ozean kann zu einem verringerten Sauerstoffgehalt in den tieferen Wasserschichten führen, da es weniger Zirkulation gibt, um Sauerstoff von der Oberfläche nach unten zu bringen.
Es wäre also sehr wünschenswert, wenn wir eine deutliche Temperaturabnahme der globalen Meeresoberfläche bis Ende August und in den folgenden Monaten beobachten könnten.
Wenn diese Abkühlung nicht eintritt, wird es immer schwieriger, die zukünftige Klimaentwicklung zu beurteilen und die Wirksamkeit von Gegenmaßnahmen einzuschätzen.
Das Problem ist allerdings nicht, dass die Klimamodelle neu justiert werden müssen, sondern dass die Menschheit viel schneller Klima- und Wetterphänomene erleben könnte, wie sie in den letzten 12.000 Jahrennie vorgekommen sind.
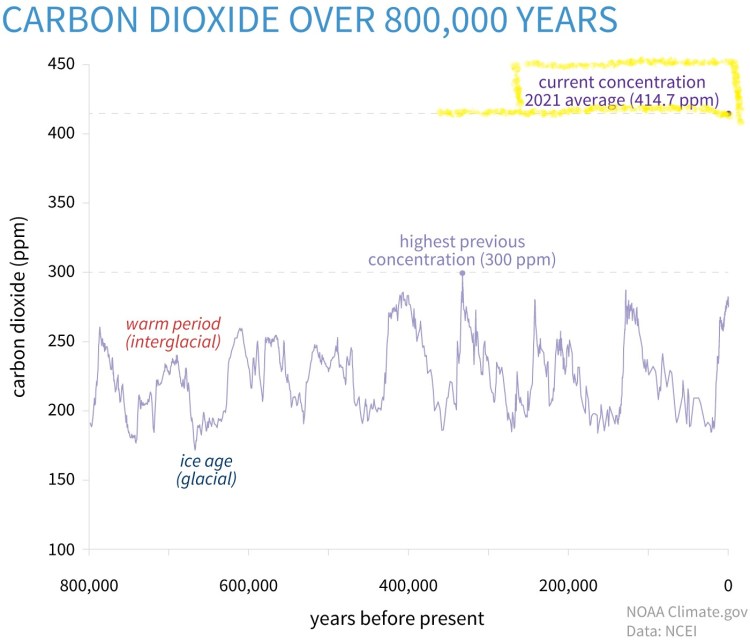
Die vom Menschen verursachte Veränderung des globalen Klimas wird häufig mit dem Begriff “Anthropozän” verbunden, der für das “Zeitalter des Menschen” steht. Die Veränderung des globalen Klimas, hervorgerufen durch eine starke Erhöhung der CO₂-Konzentration in der Atmosphäre im Vergleich zu den letzten 800.000 Jahren (aktuell 425 ppm gegenüber 300 ppm, was einem Anstieg von 41 % gegenüber dem CO₂-Maximum der letzten 800.000 Jahre entspricht), ist jedoch nur eine Seite des menschlichen Fußabdrucks.
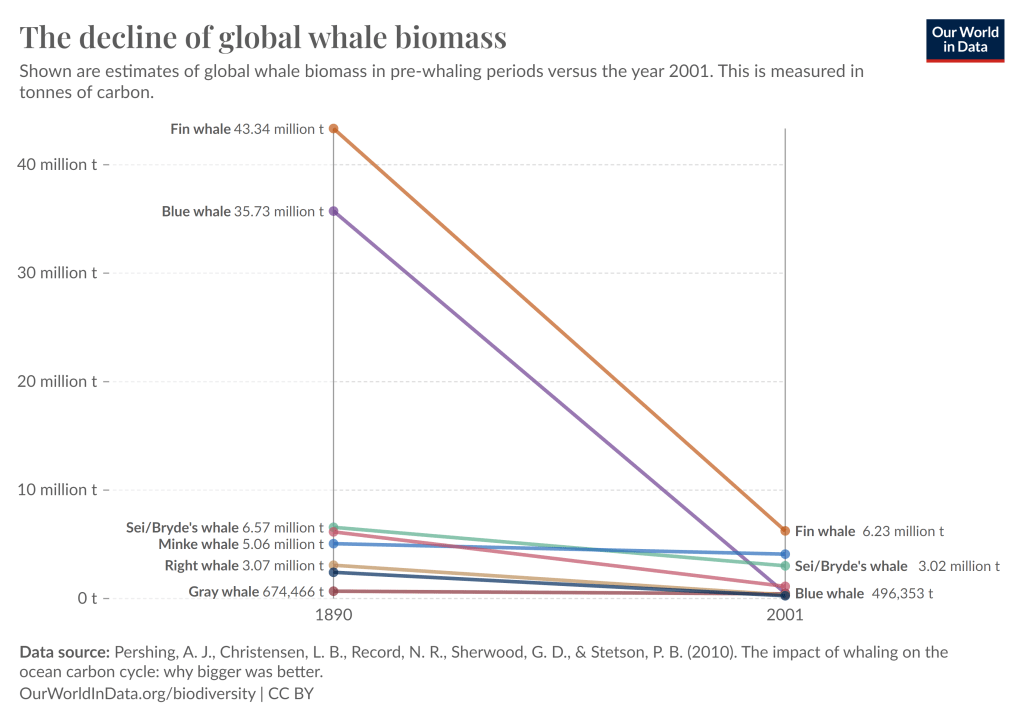
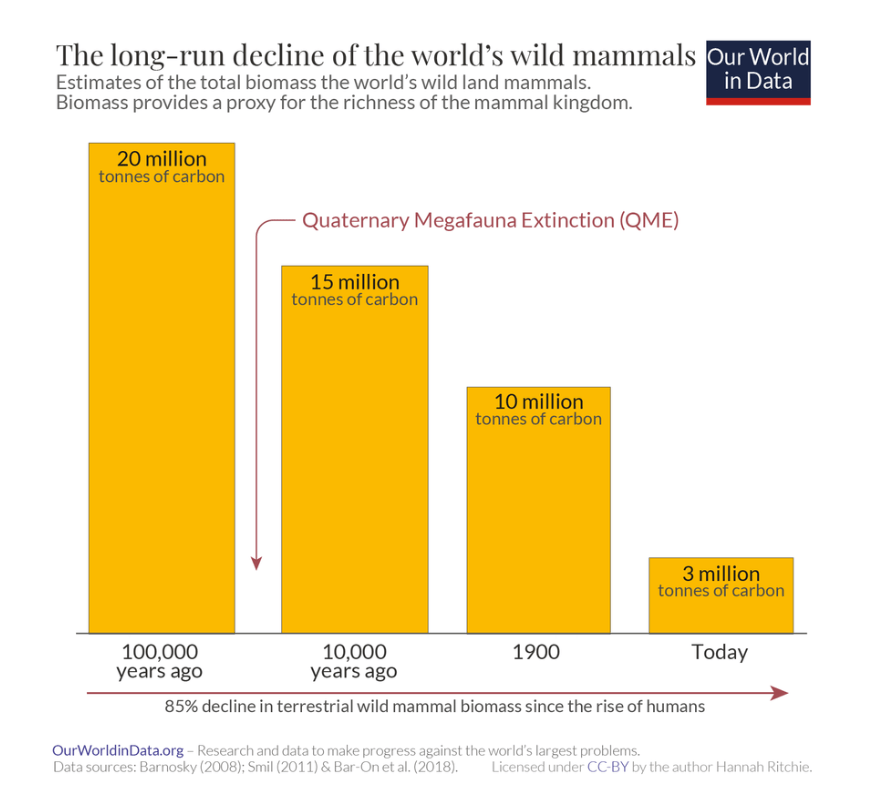
Sehr viel drastischer wird der Einfluss des Menschen an der Reduktion der natürlichen Biomasse deutlich. Ein fürchterlich menschlicher Begriff, der alles Leben, Pflanzen wie Tiere, in Tonnen abmisst. So betrug die natürliche Biomasse vor der Industrialisierung 2.000 Milliarden Tonnen. Der Mensch hat diese Biomasse in den letzten 200 Jahren auf 1.200 Milliarden Tonnen “reduziert”, ich bevorzuge den Begriff massakriert.
Was diese “Reduktion” bedeutet, kann man etwas besser erahnen, wenn man folgende Grafiken sich vergegenwärtigt:
Ich glaube, diese Grafiken sprechen für sich. Gleichzeitig hat der Mensch die Produktion von anthropogenen Stoffen, wie Stahl, Beton und Plastik mithilfe fossiler Brennstoffe in den letzten 200 Jahren hochgefahren und vor zwei Jahren die Menge der natürlichen Biomasse übertroffen (man denke z.B. an die riesigen Plastikinseln im Meer). Der Faktor Mensch auf diesem Planeten ist also unbestreitbar, trotzdem tun wir Menschen das, auch so eine anthropogene Eigenschaft.
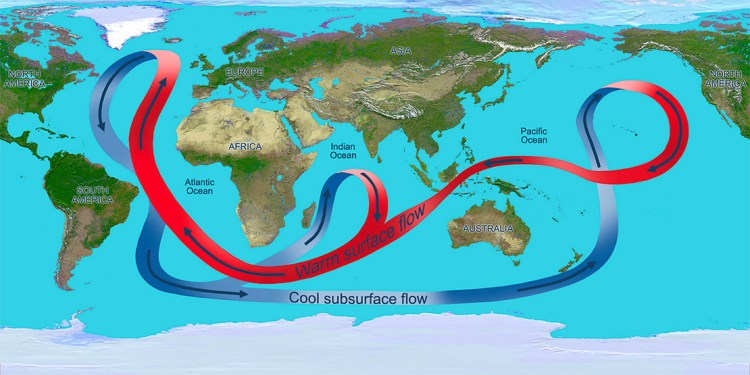
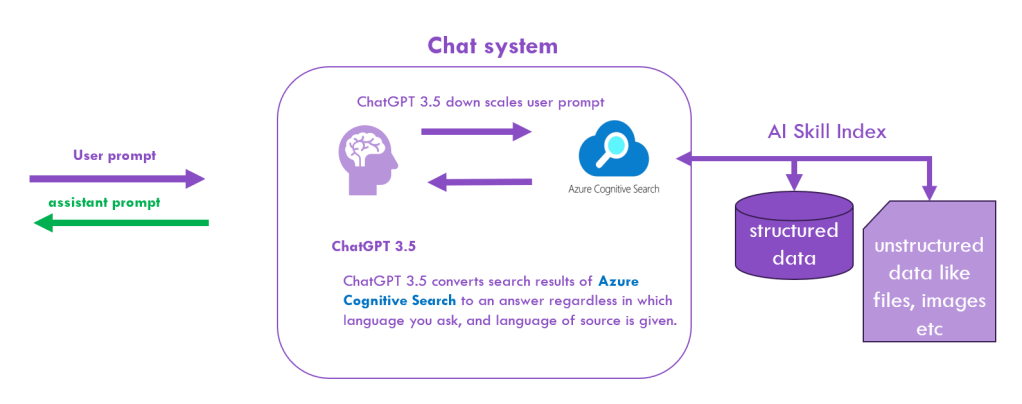
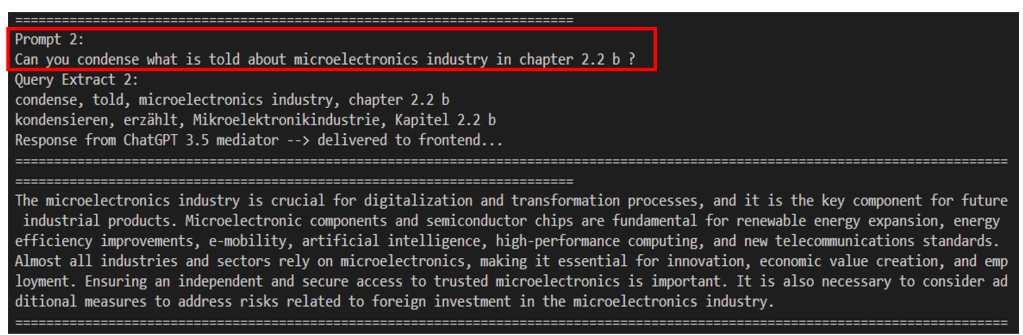
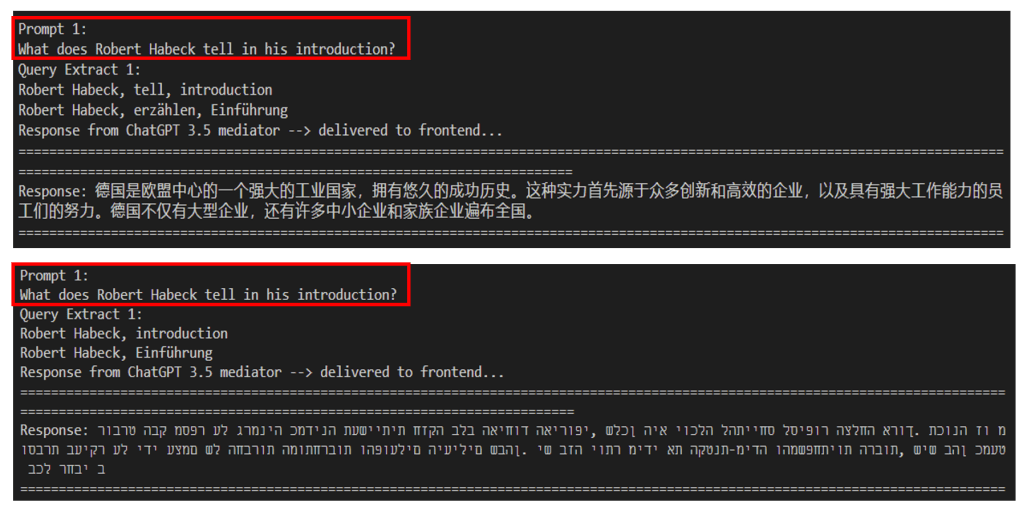
Um die schwierige Situation zu verdeutlichen, in der die Menschheit sich befindet, habe ich die jüngsten Publikationen von Professor Stefan Rahmstorf zur AMOC (Atlantic Meredial Overturning Circulation) und ein auf YouTube veröffentlichen Vortrag von Professor Schellenhuber (beide Potsdam Institut für Klimaforschung) mit ChatGPT 4o zusammen fassen lassen:
Die neuesten Erkenntnisse von Stefan Rahmstorf zum AMOC
Die Atlantische Meridionale Umwälzzirkulation (AMOC) spielt eine zentrale Rolle im globalen Klimasystem. Sie transportiert warmes Wasser aus den Tropen nach Norden und kälteres Wasser zurück in den Süden. Jüngste Forschungsergebnisse von Stefan Rahmstorf und seinem Team am Potsdam-Institut für Klimafolgenforschung deuten darauf hin, dass die AMOC aufgrund des menschlich verursachten Klimawandels signifikant geschwächt ist und möglicherweise einen kritischen Kipppunkt erreicht.
Rahmstorf betont, dass aktuelle Beobachtungen und Modellierungen zeigen, dass die AMOC seit Mitte des 20. Jahrhunderts eine deutliche Abschwächung erfahren hat. Dies wird durch das Abschmelzen des Grönlandeises und die Zufuhr von Süßwasser in den Nordatlantik verursacht, was die Dichte des Wassers verringert und die Tiefenwasserbildung beeinträchtigt. Diese Veränderung könnte schwerwiegende klimatische Folgen haben, wie drastische Temperaturveränderungen in Europa und erhöhte Meeresspiegel an der US-Ostküste (Potsdam Climate Institute) (RealClimate) (RealClimate).
Ein entscheidender Aspekt von Rahmstorfs Forschung ist die Identifizierung von frühen Warnsignalen, die auf ein bevorstehendes Kippen der AMOC hinweisen könnten. Diese Signale basieren auf physikalischen Modellen, die zeigen, dass die Stabilität der AMOC durch fortgesetzte Erwärmung und Süßwasserzufuhr gefährdet ist. Rahmstorf warnt davor, dass ohne eine rasche Reduktion der Treibhausgasemissionen das Risiko eines Kollapses der AMOC erheblich steigt. Ein solcher Kollaps würde nicht nur das europäische Klima drastisch verändern, sondern auch globale Wetter- und Klimamuster beeinflussen, was zu weitreichenden ökologischen und ökonomischen Konsequenzen führen könnte (Potsdam Climate Institute) (RealClimate) (RealClimate).
Schellnhubers Vortrag zur Klimakrise und dem Anthropozän
Professor Hans Joachim Schellnhuber, ein weiterer führender Klimawissenschaftler, betont in seinem Vortrag die tiefgreifenden Veränderungen, die durch das Anthropozän – das Zeitalter des Menschen – verursacht wurden. Er stellt fest, dass die Menschheit die natürliche Biomasse des Planeten durch die Produktion von anthropogenen Materialien wie Beton, Stahl und Plastik übertroffen hat. Diese Entwicklung hat gravierende Auswirkungen auf das globale Ökosystem und das Klima.
Schellnhuber erklärt, dass vor der industriellen Revolution etwa 2000 Milliarden Tonnen lebender Biomasse existierten. Durch menschliche Aktivitäten wurde diese Menge auf etwa 1200 Milliarden Tonnen reduziert. Gleichzeitig hat die Masse der vom Menschen produzierten Materialien inzwischen die der natürlichen Biomasse übertroffen. Diese Verschiebung wird als ein Kennzeichen des Anthropozäns angesehen und verdeutlicht die tiefgreifende und oft zerstörerische Rolle des Menschen im Erdsystem.
Ein zentrales Thema in Schellnhubers Vortrag ist die Notwendigkeit, nachhaltige Materialien und Bauweisen zu fördern. Er argumentiert, dass der Bausektor erheblich zur Freisetzung von Treibhausgasen beiträgt und eine Umstellung auf Bio-basierte Baustoffe, wie Holz, nicht nur Emissionen reduzieren, sondern auch CO₂ aus der Atmosphäre binden könnte. Er nennt dies die “große Materialwende”, bei der die gebaute Umwelt zu einer Kohlenstoffsenke wird und somit aktiv zur Klimastabilisierung beiträgt.
Historische Verantwortung der Europäer
Ein weiterer wichtiger Punkt, den Schellnhuber hervorhebt, ist die historische Verantwortung der Europäer für den derzeitigen Zustand der globalen Umwelt. Er weist darauf hin, dass europäische Länder durch ihre kolonialen Aktivitäten erheblich zur Entwaldung und zur Emission von Treibhausgasen beigetragen haben. Diese historischen Emissionen resultieren nicht nur aus der Industrialisierung in Europa selbst, sondern auch aus der Ausbeutung von Ressourcen in den Kolonien.
Schellnhuber verdeutlicht, dass Länder wie z.B. die Niederlande durch die Entwaldung in ihren ehemaligen Kolonien, insbesondere in Indonesien, eine enorme Menge an Treibhausgasen freigesetzt haben. Diese historische Verantwortung verpflichtet die Industrieländer, führend bei den Bemühungen zur Bekämpfung des Klimawandels zu sein und den Globalen Süden in seinen nachhaltigen Entwicklungszielen zu unterstützen.
Zusammenfassend betont Schellnhuber die Notwendigkeit einer globalen Zusammenarbeit und einer Umstellung auf nachhaltige Praktiken, um die Klimakrise zu bewältigen. Nur durch innovative Ansätze und internationale Solidarität kann die Menschheit die Herausforderungen des Anthropozäns meistern und eine lebenswerte Zukunft sichern.
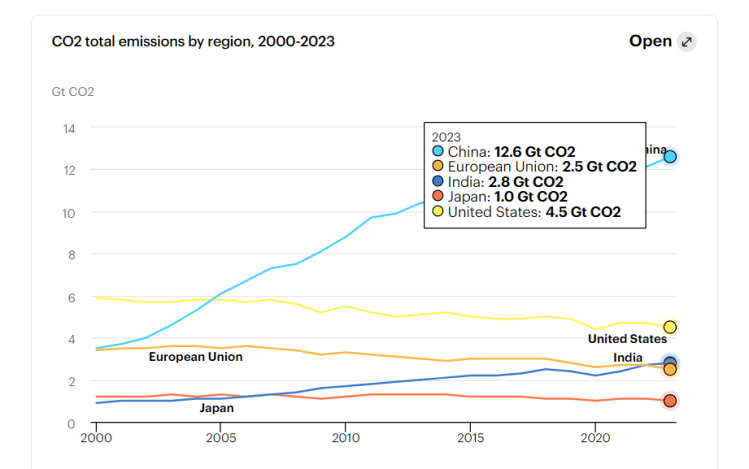
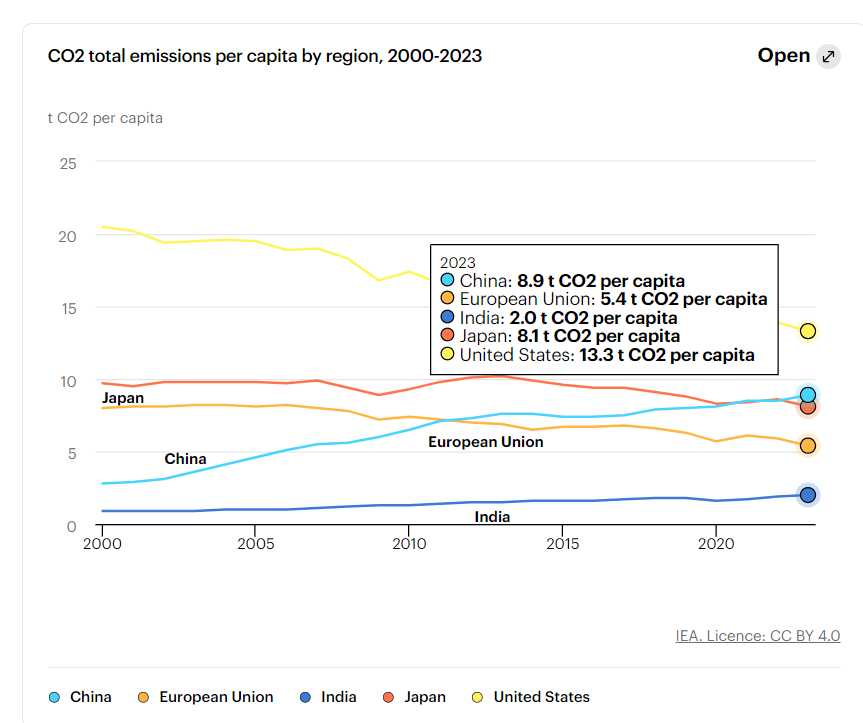
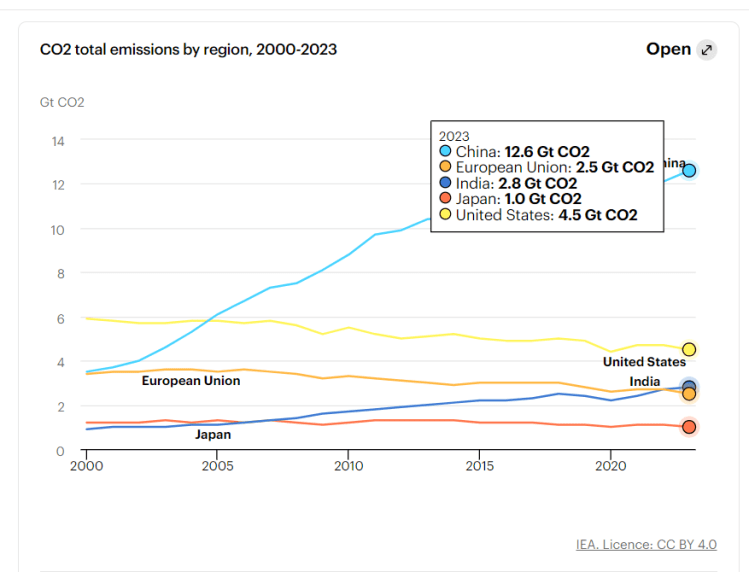
Ich persönlich glaube nicht, dass es diese internationale Solidarität ausreichend gibt. Wenn es sie gäbe, mit einer gewissen Selbstreflexion, würden die Menschheit nichts anderes tun, also Wege zu finden, dass in Indien nicht das Gleiche passiert wie in China von 1990 bis heute:
Das Rad des Fortschritts des Menschen ist nicht so einfach zurückzudrehen und dass alle Menschen auf diesen Planeten den gleichen Wohlstand wie Europäer und Nordamerikaner haben wollen, ist selbstredend.
Aber der Fortschritt hat viele Schattenseiten, die in erster Linie auch nicht beabsichtigt waren und nicht im Entferntesten absehbar waren. So fing das Zeitalter des Anthropozän aus meiner Sicht und etlichen Wissenschaftlern aus verschiedensten Gebieten lang vor der Industrialisierung im 18. Jahrhundert an:
Neolithische Revolution als Beginn des Anthropozäns
Die neolithische Revolution:
Definition und Bedeutung: Die neolithische Revolution, die vor etwa 10.000 bis 12.000 Jahren begann, markiert den Übergang von Jäger- und Sammlergesellschaften zu sesshaften agrarischen Gemeinschaften. Diese Veränderung führte zu tiefgreifenden sozialen, ökonomischen und ökologischen Transformationen.
Auswirkungen: Mit der neolithischen Revolution begann der Mensch, die Landschaft in großem Maßstab zu verändern, Wälder zu roden und Tiere zu domestizieren. Dies führte zu ersten signifikanten Veränderungen im Ökosystem und den globalen biogeochemischen Kreisläufen.
Argumente für ein früheres Anthropozän
Frühe Landwirtschaft und Landnutzungsänderungen:
Landwirtschaft und Viehzucht, die mit der neolithischen Revolution einhergingen, hatten tiefgreifende Auswirkungen auf die Umwelt. Die großflächige Umwandlung von Wäldern in Ackerland und Weideflächen führte zu einem Rückgang der natürlichen Vegetation und einer Veränderung der Biodiversität.
Diese frühzeitigen Eingriffe in die Natur veränderten die Zusammensetzung der Atmosphäre, insbesondere durch den Anstieg von Methan- und CO2-Konzentrationen aufgrund von Rodungen und der Bewirtschaftung von Reisfeldern.
Archäologische und geologische Beweise:
Geologische Untersuchungen zeigen, dass bereits in der Zeit der neolithischen Revolution messbare Spuren menschlicher Aktivitäten in den Sedimenten und Eisbohrkernen nachweisbar sind. Diese Indikatoren umfassen unter anderem Pollenanalysen, die auf großflächige Rodungen hinweisen, sowie Spuren von landwirtschaftlichen Aktivitäten.
Langfristige ökologische Veränderungen:
Der Übergang zur sesshaften Lebensweise führte zu einer drastischen Erhöhung der menschlichen Population und der Nutzung natürlicher Ressourcen. Diese Entwicklungen setzten Prozesse in Gang, die die globalen Umweltbedingungen nachhaltig veränderten und die Basis für spätere industrielle Eingriffe schufen.
Diskussion und Kontroversen
Gegenüberstellung zur industriellen Revolution:
Während die industrielle Revolution unbestreitbar eine bedeutende Zäsur in der menschlichen Geschichte und Umweltwirkung darstellt, argumentieren einige Wissenschaftler, dass die tiefgreifenden Veränderungen der Umwelt und der Ökosysteme bereits mit der neolithischen Revolution begannen.
Die industrielle Revolution brachte eine exponentielle Beschleunigung dieser Prozesse mit sich, besonders durch die Nutzung fossiler Brennstoffe und die damit verbundene Freisetzung großer Mengen von Treibhausgasen
Quellen
Lewis, S. L., & Maslin, M. A. (2015). Defining the Anthropocene. Nature, 519, 171-180.
Steffen, W., Crutzen, P., & McNeill, J. (2007). The Anthropocene: Are humans now overwhelming the great forces of nature? Ambio, 36(8), 614-621.
Bonneuil, C., & Fressoz, J. (2016). The shock of the Anthropocene: The earth, history, and us. Verso, London.
Rull, V. (2017). The “Anthropocene”: Neglects, misconceptions, and possible futures. EMBO Reports, 18(7), 1056-1060.
Mit diesem Querverweis möchte ich auch erinnern, dass nicht nur die Industrie, das Auto und die Heizung zum Klimawandel beitragen, sondern in einem unfassbar großen Maße auch die moderne Landwirtschaft inklusive der Reduzierung der Artenvielfalt. Obwohl es in Europa nur noch sehr wenige Bauen gibt:
Etwa 4,2 % der Gesamtbeschäftigung in der EU entfällt auf die Landwirtschaft, was etwa 9,4 Millionen Menschen entspricht (European Commission) (European Commission).Alter und Geschlecht: Die meisten landwirtschaftlichen Betriebsleiter sind männlich (68,4 %) und älter als 55 Jahre (57,6 %). Junge Landwirte unter 40 Jahren machen nur 11,9 % aus (European Commission). Generationswechsel: Ein Problem in der EU ist der langsame Generationswechsel in der Landwirtschaft. Nur 6,5 % der Betriebsleiter sind jünger als 35 Jahre, während etwa ein Drittel der Betriebsleiter 65 Jahre oder älter ist (European Commission)
…ist ihr politischer Einfluss immer noch erheblich, wie die aktuelle Bundesregierung zu spüren bekam. Was aber nichts daran ändert, dass man heute z.B. Flüssen lieber wünschen sollte durch industrialisierte Umgebungen zu fließen, da die Umweltauflagen innerhalb der EU für Industrieanlagen wesentlich schärfer sind als für die Landwirtschaft.
Gründe für den besseren Zustand von Flüssen in industriellen Gebieten
Strenge Umweltauflagen und Regulierung:
Die Europäische Union hat strenge Umweltvorschriften eingeführt, die die Emissionen und Abwassereinleitungen aus der Industrie stark regulieren. Dazu gehört die Wasserrahmenrichtlinie (WRRL), die darauf abzielt, den Zustand aller Gewässer in der EU zu verbessern und zu schützen.
Industriebetriebe sind verpflichtet, fortschrittliche Reinigungstechnologien zu nutzen und Schadstoffe zu minimieren, bevor sie in die Umwelt freigesetzt werden dürfen.
Kontinuierliche Überwachung und Sanktionen:
Industrielle Einleiter werden streng überwacht, und es gibt empfindliche Strafen für Verstöße gegen Umweltvorschriften. Dies hat dazu geführt, dass viele Industriebetriebe erhebliche Investitionen in Umweltschutzmaßnahmen getätigt haben (Mein ehemaliger Arbeitgeber Emprise aus Düsseldorf, hatte eine Abrechnungssoftware geschrieben, die aus Schadstoffanalysen aus dem Rhein, sofort den Verursacher ermittelte und ihm eine saftige Rechnung für die Einlassung von Schadstoffen in den Rhein zukommen ließ).
Probleme in landwirtschaftlich genutzten Gebieten
Eutrophierung durch Nährstoffeinträge:
In landwirtschaftlichen Gebieten ist Eutrophierung ein großes Problem, das durch übermäßigen Eintrag von Nährstoffen wie Nitrat und Phosphat aus Düngemitteln und Gülle verursacht wird. Diese Nährstoffe gelangen durch Oberflächenabfluss in die Flüsse und Seen, was zu übermäßigem Algenwachstum und Sauerstoffmangel im Wasser führt.
Studien zeigen, dass die Eutrophierung zu einer Verschlechterung der Wasserqualität und zum Verlust der Biodiversität in aquatischen Ökosystemen führt.
Unzureichende Regulierung und Überwachung:
Während es auch in der Landwirtschaft Vorschriften zur Reduzierung von Nährstoffeinträgen gibt, sind diese oft weniger streng und weniger effektiv durchgesetzt als in der Industrie. Viele landwirtschaftliche Betriebe verwenden weiterhin hohe Mengen an Düngemitteln, was die Eutrophierung verschärft.
Unterstützung durch wissenschaftliche Studien und Berichte
Ein Bericht der Europäischen Umweltagentur (EEA) aus dem Jahr 2018 bestätigt, dass landwirtschaftliche Aktivitäten die Hauptquelle für Nährstoffeinträge in Gewässer sind und diese Einträge die Wasserqualität in vielen europäischen Flüssen und Seen beeinträchtigen.
Eine Studie, die im Journal “Science of the Total Environment” veröffentlicht wurde, zeigte, dass Flüsse in landwirtschaftlichen Regionen tendenziell höhere Konzentrationen von Nährstoffen und schlechtere ökologische Zustände aufweisen als Flüsse in industriellen Gebieten, die strenger reguliert werden.
Quellen:
Europäische Umweltagentur (EEA), “European waters — Assessment of status and pressures 2018.”
Journal “Science of the Total Environment”, Artikel zur Wasserqualität in landwirtschaftlichen vs. industriellen Gebieten.
Europäische Kommission, “Water Framework Directive and the European Waters.”
Ich erwähne meinen Standpunkt, dass das Anthropozän eher mit der neolithischen Revolution anfing als mit der Industrialisierung, um zu verdeutlichen, wie tiefgreifend eine Veränderung zu nachhaltigen Energiequellen und Kreislaufprozessen in der industriellen und landwirtschaftlichen Ressourcenausnutzung ist.
Ich gebe Professor Schellnhuber sicherlich recht, wir sollten CO₂ Klimasenken aufbauen und Kreislaufprozesse als Standard initiieren, möglich ist das, aber uns läuft definitiv die Zeit davon. Wir haben insbesondere ab den 70er-Jahren sehr viel Zeit vergeudet, das Problem anzugehen, nun fegt der Klimawandel und das Artensterben über uns hinweg, was von uns übrig bleibt, aus meiner Sicht, will ich im folgenden Teil des Blogs erläutern.
Ich komme zurück auf Indien. Ich war nie in Südostasien, habe aber als Programmierer zahlreiche Kollegen aus Indien gehabt. Es sind hervorragend ausgebildete Leute und Indien dominiert seit Jahrzehnten den IT Workforce Markt, mit den zweifellos erfolgreichsten Anwärtern, den CEOs von Microsoft und Google. Trotzdem ist die Kluft zwischen wundersamen Reichtum und aus europäischer Sicht hoffnungsloser Armut in Indien bestehen geblieben bzw. noch stärker geworden. Aus europäischer Sicht kann ein ökologischer Frieden nur mit einem sozialen Frieden einhergehen. Hat es China besser gemacht? Sie haben mit “leichtem” Anschub aus dem Westen es geschafft, 800 Millionen Menschen, zehnmal so viel, wie es Deutsche gibt, in europäische Verhältnisse und zum Teil sogar darüber in den letzten 30 Jahren zu hieven. Zweifellos ein immenser sozialer Erfolg. Ökologisch sieht das Ganze anders aus. Die Unmengen Zement und Beton, die für die Hochhausschluchten in China verbaut wurden, führten den gleichen chemischen Prozess aus, wie beim Aufbau der USA und dem Aufbau inklusive Wiederaufbau Europas im 18. bis 20. Jahrhundert, nur ging die Emissionen und der Aufbau noch schneller von statt:
Bei der Herstellung von Zement, einem Hauptbestandteil von Beton, wird Kalkstein (CaCO3) in einem Prozess namens Kalzinieren erhitzt, um Calciumoxid (CaO) und Kohlendioxid (CO₂) zu erzeugen. Der chemische Prozess ist: CaCO3 → CaO + CO₂. Zusätzlich wird bei der Erhitzung des Kalksteins und anderer Rohstoffe in Drehrohröfen fossiler Brennstoff verbrannt, was ebenfalls zur Freisetzung von CO₂ führt. Calciumoxid (CaO) wird anschließend mit anderen Materialien wie Ton bei hohen Temperaturen zu Klinker verbrannt, aus dem später Zement hergestellt wird. Das CO₂ vom chinesischen Bauboom wabert nun in der Atmosphäre. Und auch ökonomisch muss man heute Chinas Bauboom wohl mit einigen Fragezeichen versehen? Ich möchte nicht wissen, wie zahlreiche Chinesen sich fühlen, die einen großen Baukredit abzahlen müssen, obwohl ihr Apartment im Rohbau stecken blieb und nie fertig werden wird.
Kann es jetzt beim Aufstieg Indiens ökologisch wie sozial besser laufen? Persönlich kann ich mir das nicht vorstellen, auch wenn beim Durchstarten Indiens regenerative Energien sicher eine größere Rolle spielen werden als in China zu Beginn der 90er. Und China macht große Fortschritte beim Ausbau regenerativer Energien. 2060 will es CO₂-neutral sein.
Insgesamt sind regenerative Energiequellen, aber auch Recyclingprozesse auf dem Vormarsch, aber ich denke, sie kommen zunächst zu spät, was kein Aufruf dazu ist, diese Entwicklung zu stoppen. Ich denke aber wir müssen die Entwicklung der Menschheit sehr viel langfristiger sehen und ohne großen “Set Back” für die Menschheit, wird aus meiner Sicht nicht laufen.
Meine These ist, das Klimasystem ist gekippt und selbst wenn es bis jetzt nicht gekippt ist, dann wird es sehr wahrscheinlich in diesem Jahrhundert kippen. Warum denke ich, dass das System gekippt ist?
Ich möchte hierzu zwei Grafiken einbringen. Die Erste zeigt den täglichen Temperaturverlauf des Oberflächenwassers der Meere zwischen den Breitengraden 60 ° Nord bis 60° Süd:
Die Energiemenge, die man benötigt, um so einen Temperatursprung durchzuführen, für eine so große Wassermenge ist beträchtlich. Und die bisherigen Erklärungen der Wissenschaft sind, aus meiner persönlichen Sicht, dürftig.
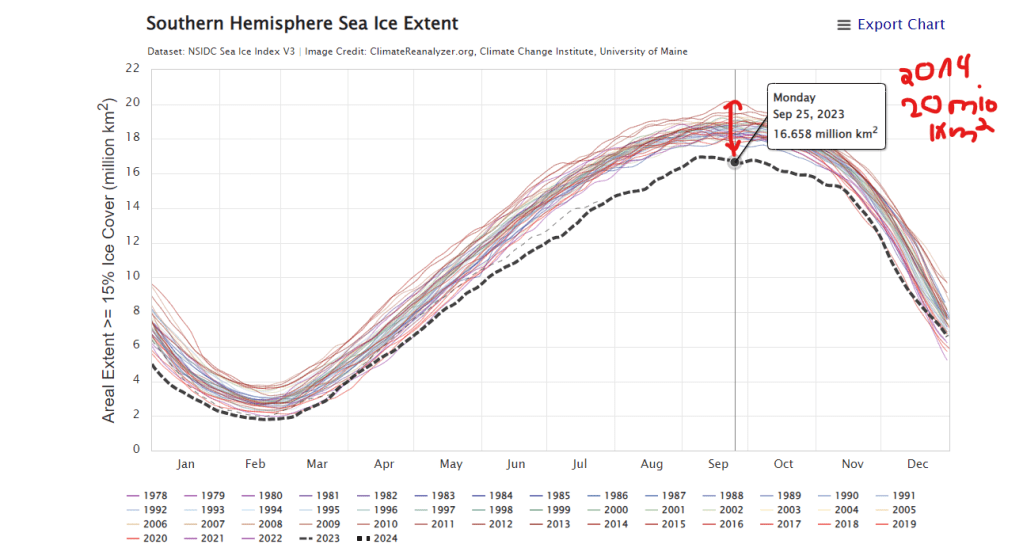
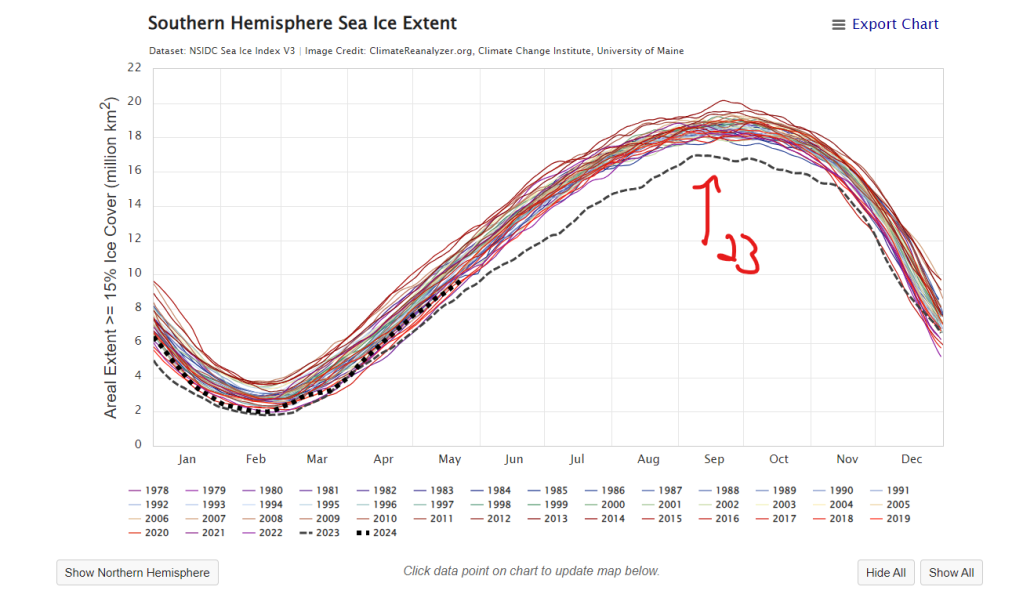
Gleichzeitig ist am Südpol 2023 eine unglaublich große Lücke beim Aufbau des Wintereises auf der Südhalbkugel entstanden. Vergleicht man die Eismenge zu dieser Jahreszeit zwischen 2014 und 2023, so ergibt sich eine Lücke von 3,6 Quadratkilometern. Das entspricht der Fläche des Subkontinentes Indien. Auch für 2024 sieht es tendenziell nicht viel besser aus:
Das ist natürlich nur eine Gefühlsaussage, ich bin kein Klimaforscher und beschäftige mich mit diesem Thema als informierter Bürger mit ingenieurwissenschaftlichen Sachverstand. Für Ingenieure gilt neben Thermodynamik, Relativitätstheorie und Quantenmechanik noch ein weiteres essenzielles Gesetz: What can go wrong, goes wrong. Frei nach Alan Murphy und im Grunde ist das die Ingenieur-Variante des zweiten thermodynamischen Hauptsatzes: Die Entropie eines geschlossenen Systems steigt. Etwas freier formuliert. Der natürliche Drang eines Systems ist von Ordnung zu Unordnung (Chaos). Prozesse, von Menschen initiiert, die versuchen, das Rad in kürzester Zeit umzudrehen, sind oft zum Scheitern verurteilt. Das liegt hauptsächlich an der Nichtlinearität der Vorgänge. Ingenieure versuchen durch Abstecken geeigneter Randbedingungen, den Prozess im linearen Bereich zu halten. Gelingt das, können Ingenieure und Anwender gut schlafen, gelingt es nicht, müssen die Lösungen wesentlich aufwendiger gestaltet werden.
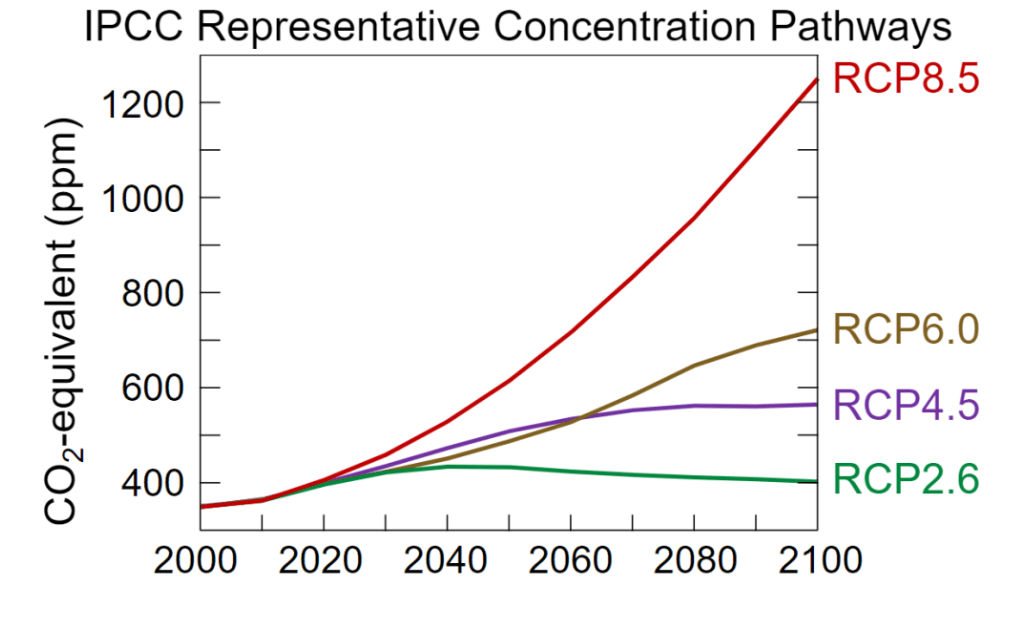
Um die Erderwärmung auf unter 2 Grad zu halten, müssten wir bis 2030 die CO₂-Emissionen um 40 % sinken im Vergleich zu den Emissionen 2010, sagen die Modelle der Klimaforscher. Sie steigen aber, wenn auch deutlich langsamer als in den Nuller Jahren. Die IEA (International Energy Agency) wiederum prognostiziert, dass wenn alle Zusagen über regenerative Energiequellen aus den verschiedenen Regionen eingehalten werden, dann können wir maximal den Emissionszustand von 2010 halten (siehe auch mein Blog: https://chrisfaustulus.com/2024/05/24/95/).
Die Natur verzeiht nicht, sie bestraft aber auch nicht, sie hält sich einfach nur an ihre Gesetze und da wir durch die Ausnutzung der fossilen Energie bei gleichzeitigem Artenabbau erheblich die Rahmenbedingungen verändert haben, entwickeln die immer noch gleichen Naturgesetze jetzt eine immer unvorteilhaftere Zukunft für uns.
Wir sollten allerdings, das der Natur nicht übel nehmen. Sie macht nur ihren Job. Wir könnten durch unseren freien Willen, den wir aus meiner Sicht haben, weil wir die Zukunft nicht kennen und Zeitreisen nur, in der Netflix Welt passieren, die Rahmenparameter wieder zu unserem Vorteil verändern. Doch dazu gehört Einsicht und da hapert es dann doch.
Ich halte daher Szenarien, wie sie schon in den 70ern im Film Soylent Green (deutscher Titel: “Jahr 2022 … die überleben wollen”) mit Charlton Heston in der Hauptrolle skizziert wurden, für wesentlich wahrscheinlicher. Der Film basiert lose auf dem Roman “Make Room! Make Room!” von Harry Harrison und spielt im Jahr 2022 in einer überbevölkerten, umweltzerstörten Welt.
In der überbevölkerten und durch Umweltverschmutzung zerstörten Welt des Jahres 2022 kämpfen die Menschen ums Überleben. Nahrung ist knapp, und die meisten Menschen sind auf synthetische Lebensmittel angewiesen, die von der Soylent Corporation hergestellt werden. Das neueste und begehrteste Produkt ist “Soylent Green“, das angeblich aus Plankton hergestellt wird und die einzige nahrhafte Nahrungsquelle darstellt.
Charlton Heston spielt den Polizisten Detective Robert Thorn, der in New York City ermittelt. Er wird beauftragt, den Mord an William R. Simonson (Joseph Cotten), einem reichen und einflussreichen Mitglied der Soylent Corporation, zu untersuchen. Bei seinen Ermittlungen stößt Thorn auf Hinweise, dass Simonson von den eigenen Leuten ermordet wurde, um ein schreckliches Geheimnis zu bewahren.
Während Thorn tiefer gräbt, erfährt er, dass die Ressourcen der Erde erschöpft sind und das Plankton im Ozean nahezu verschwunden ist. Schließlich entdeckt er die schockierende Wahrheit: Soylent Green wird nicht aus Plankton hergestellt, sondern aus den Leichen verstorbener Menschen, die in großen Recyclinganlagen zu Nahrung verarbeitet werden.
Der Film endet mit Thorn, der schwer verletzt ist und die Wahrheit über Soylent Green öffentlich machen will. Mit den Worten “Soylent Green is people!” (“Soylent Green besteht aus Menschen!“) versucht er, die Menschen zu warnen.
Was mir in Erinnerung an den Film so schaurig übrig blieb, war die Erkenntnis, dass ich es uns zutraue, dass wir zum Schluss, wenn die Erde wie eine Zitrone vollkommen ausgequetscht ist, wir über uns selbst herfallen und in einer viel perfideren Art als wir es ohnehin in Kriegen und ähnlichem schon immer taten.
26 Jahre später leitet ein weiterer Film für mich die Zukunft ein: die Matrix, pünktlich vor der Jahrtausendwende.
In dieser Zeit arbeite ich zusammen mit etwa 200 Entwicklern aus Israel, Indien und Osteuropa intensiv an der Code-Entwicklung des neuen Customer Care & Billing Systems der Mannesmann D2 Mobilfunk GmbH, später Vodafone D2. Wir sind Zeugen des rasanten Wachstums von Mobilfunk und Internet, die sich gegenseitig verstärken. Wir legen die Grundlagen dafür, dass das Internet fortan jederzeit in jeder Hosentasche verfügbar ist, und erleben hautnah, wie der virtuelle Raum, geschaffen von intelligenten Maschinen, unsere Realität neu formt.
Worum geht es in der Matrix aus dem Jahr 1999, der von den Wachowskis geschrieben und inszeniert wurde. Er gilt als einer der einflussreichsten Filme seines Genres und hat eine tiefgreifende Geschichte, die Themen wie Realität, Bewusstsein und Freiheit behandelt.
Teil 1: Die Realität hinterfragen
Thomas A. Anderson (gespielt von Keanu Reeves) lebt ein Doppelleben. Tagsüber arbeitet er als Programmierer in einem großen Unternehmen, nachts ist er als Hacker unter dem Namen Neo bekannt. Er fühlt sich in seiner Welt fremd und sucht nach der Antwort auf die Frage: “Was ist die Matrix?”
Neo wird von einer geheimnisvollen Gruppe kontaktiert, die von Morpheus (Laurence Fishburne) angeführt wird. Morpheus glaubt, dass Neo der “Auserwählte” ist, der die Menschheit befreien kann. Neo wird zu einem Treffen mit Morpheus geführt, bei dem ihm zwei Pillen angeboten werden: eine rote und eine blaue. Neo entscheidet sich für die rote Pille, die ihm die Wahrheit zeigt.
Teil 2: Die wahre Natur der Welt
Nach der Einnahme der roten Pille wacht Neo in der realen Welt auf, einer post-apokalyptischen Zukunft, in der die Menschheit von intelligenten Maschinen unterjocht wird. Die Maschinen nutzen Menschen als Energiequellen, indem sie ihre Körper in riesigen Anlagen “züchten” und ihre Gehirne in eine simulierte Realität namens die Matrix einspeisen.
Morpheus und seine Crew, darunter Trinity (Carrie-Anne Moss) und Cypher (Joe Pantoliano), befreien Neo und bringen ihn auf ihr Schiff, die Nebuchadnezzar. Sie erklären ihm, dass die Matrix eine künstliche Welt ist, die die Menschen in einer virtuellen Realität gefangen hält, während ihre Körper in Wirklichkeit in Kapseln liegen und den Maschinen als Energiequelle dienen.
Teil 3: Der Kampf gegen die Maschinen
Morpheus trainiert Neo, die Regeln der Matrix zu verstehen und zu manipulieren. Neo entwickelt schnell außergewöhnliche Fähigkeiten, die darauf hindeuten, dass er tatsächlich der Auserwählte ist. Währenddessen plant Cypher, der von der harten Realität des wahren Lebens desillusioniert ist, die Gruppe zu verraten und in die Matrix zurückzukehren.
Der Höhepunkt des Films ist ein waghalsiger Rettungseinsatz, um Morpheus zu befreien, der von den Agenten, programmierten Wächter der Matrix, gefangen genommen wurde. Neo und Trinity dringen in ein schwer bewachtes Gebäude ein und retten Morpheus in einer spektakulären Action-Sequenz.
Teil 4: Neo akzeptiert sein Schicksal
In der finalen Konfrontation mit Agent Smith (Hugo Weaving) erkennt Neo seine wahre Macht. Er begreift, dass er die Matrix nach Belieben manipulieren kann. In einer symbolischen Szene wird er von Kugeln beschossen, bleibt jedoch unverletzt und kann die Kugeln stoppen. Schließlich besiegt er Agent Smith, indem er in ihn “eindringt” und ihn von innen heraus zerstört.
Der Film endet damit, dass Neo die Matrix verlässt und eine Nachricht an die Maschinen sendet, in der er erklärt, dass er die Menschen befreien wird.
Der Film hat viele Einflüsse, darunter philosophische Ideen von Descartes über den Zweifel an der Realität und Platons Höhlengleichnis, das die Unterscheidung zwischen der Welt der Sinne und der wahren Welt behandelt. Weiterhin ist er stark von Cyberpunk-Literatur und Anime inspiriert.
Beeindruckend finde ich, dass Platon mit seinem Höhlengleichnis schon vor 2400 Jahren sehr genau unsere Probleme mit der Realität skizzierte, aber sein Glaube, dass wir über Bildung vom Dunkeln ins Licht uns erheben, dieser Glaube und Hoffnung, sie sind bei mir erschüttert.
Worum geht es in Platons Höhlengleichnis?
Platons Höhlengleichnis ist eine der bekanntesten Metaphern der westlichen Philosophie, die in Platons Werk “Der Staat” (Buch VII) zu finden ist. Es illustriert seine Vorstellungen von Erkenntnis, Wahrheit und Bildung:
Das Höhlengleichnis
Die Situation in der Höhle Platon beschreibt eine Gruppe von Menschen, die ihr ganzes Leben in einer dunklen Höhle gefesselt verbringen. Sie sind so festgebunden, dass sie nur auf eine Höhlenwand blicken können. Hinter ihnen brennt ein Feuer, und zwischen dem Feuer und den Gefangenen befindet sich ein erhöhter Weg. Auf diesem Weg tragen andere Menschen verschiedene Gegenstände und Figuren, die Schatten an die Höhlenwand werfen.
Die Schatten als einzige Realität Für die Gefangenen sind die Schatten an der Wand die einzige Realität, die sie kennen. Sie haben nie die tatsächlichen Objekte gesehen, sondern nur deren Schatten. Daher nehmen sie an, dass die Schatten die wirkliche Welt darstellen.
Die Befreiung eines Gefangenen Einer der Gefangenen wird schließlich befreit und gezwungen, sich umzudrehen und das Feuer zu sehen. Zunächst ist er geblendet und verwirrt, da er nie etwas anderes als die Schatten gesehen hat. Langsam beginnt er zu erkennen, dass die Schatten nur Abbilder von echten Gegenständen sind.
Der Aufstieg ins Licht Der befreite Gefangene wird weiter aus der Höhle herausgeführt. Als er die Höhle verlässt, wird er von dem hellen Sonnenlicht geblendet und kann zunächst nichts erkennen. Mit der Zeit gewöhnt er sich an das Licht und beginnt, die Welt außerhalb der Höhle zu sehen. Er erkennt, dass die wahre Realität viel reichhaltiger und vielfältiger ist als die Schatten, die er in der Höhle gesehen hat.
Rückkehr in die Höhle Der befreite Gefangene kehrt schließlich in die Höhle zurück, um die anderen Gefangenen zu befreien und ihnen die wahre Welt zu zeigen. Doch die verbleibenden Gefangenen lehnen seine Erzählungen ab, da sie nur die Schatten kennen und diese für die einzig wahre Realität halten. Sie verspotteten ihn und weigern sich, ihm zu glauben.
Hier möchte ich abschließend noch mal einhaken. Wie schon oft gesagt, weist die Wissenschaft bereits sehr lange auf die Gefahren durch den Klimawandel und der allgemeinen Umweltzerstörung hin. Aber wie eh und je dem Boten schlechter Nachrichten hört man ungern zu, das musste schon Kassandra akzeptieren.
Müssen wir also irgendwann Soylent Green (fr)essen und in der Matrix uns vorstellen, es wäre unser liebstes Leibgericht? Die Gefahr ist groß, dass es so kommt, aber es muss nicht zwangsläufig so kommen.
Was ich jetzt sage, werden die wenigsten wohl verstehen. Es richtet sich zunächst auch nur an Europäer und Nordamerikaner und von denen auch nur an jene, denen es wirklich gut geht. Wenn diese verstünden, dass die größte Innovation des Menschen das Loslassen wäre, aufzuhören, die Natur auszutricksen, um einen Vorteil zu erlangen, der sich allzu schnell in einen Pyrrhussieg verwandelt und man der Natur (griechisch = von selbst) die Chance lässt, sich selbst zu reparieren, dann sähe ich einen kleinen Hoffnungsschimmer, dass wir nicht “köstliches” Sylont Green in der Matrix vertilgen. Einzig mir fehlt der Glaube, was aber nichts heißen muss, denn der Faktor Mensch war schon immer für eine Überraschung gut.
Many people say that we are currently living in a time of high uncertainty. I go a step further and assert that we are doomed, despite the numerous measures we’ve already taken to reduce global warming. These efforts are simply not enough. Furthermore, global warming is definitely not our only problem.
This might sound like a typical hysterical internet message, but I want to explain why I believe this. Hopefully, I am wrong in my conclusions, but let’s give them a try.
I compare the current world situation to the scene of the sinking Titanic one hour after the collision. The engineering crew becomes increasingly aware that this collision marks a point of no return. The ship will sink; the only question is how quickly it will go down.
Now, let’s come back to the year 2024, 112 years later.
Our ship today is called Earth, a very, very tiny planet in the seemingly endless universe.
Earth seen from 6 billion km. The picture was taken by Voyager I in 1990.
On April 22, 2016, representatives of the global community signed an agreement intended to lead the initiative in limiting global warming induced by incredibly high CO2 consumption: The Paris Agreement. The nations agreed to start initiatives to prevent global warming from exceeding 1.5 degrees Celsius above pre-industrial levels. This target was not chosen accidentally. Climate scientists proposed this threshold to limit the chances of triggering ecological tipping points. Moreover, the less the atmosphere and seas warm, the less we will face extreme weather events. This scenario would also give future generations enough time to scale up technologies for highly effective carbon capture from the atmosphere.
The technical counterpart of the Paris Agreement is the RCP 2.6 scenario. RCP stands for Representative Concentration Pathway, and the 2.6, which can be confusing, refers to 2.6 Watts per square meter (a measure of energy intensity) rather than temperature. Imagine covering the whole planet with a blanket. This blanket holds back radiation from the Earth, induced by sunlight. The industrial CO2 blanket has already caused an increased radiation of 2 Watts per square meter. The RCP 2.6 scenario proposes a global CO2 emission plan to ensure that the blanket does not get denser than an additional 2.6 Watts per square meter.
In the modest climate scenario, RCP 2.6, the CO2 concentration would peak between 2040 and 2070 at around 440 ppm (parts per million) and then decrease due to natural CO2 absorption through photosynthesis. However, we are already at a concentration of 425 ppm today (source: NASA).
Key Targets and Proposals for CO2 Emission Reductions by 2030 under RCP 2.6:
By 2030:
Emission Reduction: RCP 2.6 aims for a 40-50% reduction in global CO2 emissions compared to 2010 levels by 2030.
Annual Reduction Rate: This translates to an average annual reduction of 3-4% from current levels.
Total Emissions: The target is to bring down global CO2 emissions to around 20-24 billion tonnes by 2030.
By 2040:
Further Reduction: Emissions should continue to decline, reaching about 70% below 2010 levels by 2040.
Key Strategies:
Transition to Renewable Energy: Substantial increases in renewable energy deployment, especially solar, wind, and hydro.
Energy Efficiency: Enhancing energy efficiency across all sectors.
Electrification: Electrifying transportation and other sectors currently reliant on fossil fuels.
Carbon Capture and Storage (CCS): Implementing CCS technologies to reduce emissions from industrial sources.
Land Use Changes: Increasing carbon sequestration through reforestation and improved land management.
Focus on the First Target
To align with RCP 2.6, we need to reduce global CO2 emissions by 40-50% relative to 2010 levels by 2030. Let’s assess what has been achieved so far. Surprisingly, the progress is more substantial than one might think.
For the following numbers, I reference reports from the International Energy Agency (IEA), primarily the latest from 2023.
To understand how close or far we are from achieving a 40-50% reduction in global CO2 emissions compared to 2010, we need to compare the figures of 2010 and 2023 and project the trends until 2030.
CO2 Emissions in 2010
The numbers for 2010 are derived from historical emissions’ data, such as those provided by the Global Carbon Project and other reliable environmental agencies.
Emission Shares in 2010:
China: 7.94 billion tonnes (24%)
USA: 5.30 billion tonnes (16%)
India: 1.99 billion tonnes (6%)
European Union (including the UK): 4.1 billion tonnes (12%)
All Others: 13.90 billion tonnes (42%)
Total Global Emissions: 33.23 gigatonnes
CO2 Emissions in 2023
These numbers are based on the most recent data and projections from the International Energy Agency (IEA) and the Global Carbon Project.
Emission Shares in 2023:
China: 11.41 billion tonnes (31%)
USA: 5.15 billion tonnes (14%)
India: 2.94 billion tonnes (8%)
European Union: 2.58 billion tonnes (7%)
All Others: 15.32 billion tonnes (40%)
Total Global Emissions: 37.4 billion tonnes (100%)
Analysis
Comparing the data between 2010 and 2023, it’s evident that global CO2 emissions have increased by 11% instead of decreasing. Among the major emitters, only Europe has managed to reduce its carbon footprint significantly. The US emissions have stagnated, while China’s emissions have grown substantially.
Sources
Global Carbon Project: Provides comprehensive data on global carbon emissions, including historical and current emissions.
To illustrate the development of CO2 emissions more clearly, let’s look at the emission trends in graphs between 2000 and 2023. The graphs will show how emissions have changed over time for key regions and globally.
This section sets the stage for an in-depth analysis of the progress and challenges in meeting the RCP 2.6 targets by 2030. The graphical representation of emission trends will provide a visual understanding of the changes and highlight the urgency of accelerating emission reduction efforts.
CO2 Emissions Per Capita in Major Regions
As illustrated above, the CO2 emissions per capita for the major regions of our planet reveal stark differences. The United States, still a leading world power, also leads in per capita CO2 emissions with 13.3 tonnes per person. Europe is on a downward trend and, if it continues to reduce its carbon footprint by 1.3% per year, it will achieve a 40% reduction compared to 2010 levels. Between 2022 and 2023, Europe even managed a remarkable 7% reduction, although maintaining this rate is unlikely due to technical and political challenges. Nevertheless, a 1.3% annual reduction until 2030 seems realistic for Europe.
It’s also noteworthy that India’s per capita footprint remains significantly lower than that of other regions, though it is steadily increasing.
Global CO2 Emission Picture
To obtain a more realistic picture of the global CO2 emission situation, it’s essential to multiply the per capita figures by the number of inhabitants in each region. This approach provides a comprehensive view of the total emissions and highlights the impact of population size on global CO2 output.
The Rise of the Dragon and Global CO2 Emissions
The significant climate effects observed from 2000 onwards are often attributed to the rise of China, frequently referred to as the “Dragon.” However, blaming China alone for these climate impacts is not the correct conclusion. Let’s examine why.
CO2 Emissions Per Capita
China:
Per Capita Emissions: 8.1 tonnes
Total Emissions: 11.41 billion tonnes
Germany:
Per Capita Emissions: 7.5 tonnes
Germany’s per capita emissions are only slightly lower than China’s. When considering that China produces a significant amount of industrial goods for Europe and the US, some of the emissions attributed to China should arguably be redistributed to these regions’ balance sheets. Additionally, the historical context is crucial: Europe and the US were major contributors to the Industrial Revolution from the 18th century onwards, and CO2 molecules can remain in the atmosphere for up to 1,000 years. This historical accumulation is a major factor in the current climate crisis.
Historical Contributions and Economic Policies
For a long time, the economic and political opening of China was welcomed by Europe and the US, despite knowing that if China followed the same industrialization path, it could significantly destabilize global ecosystems. This was highlighted in the “Limits to Growth” report in the 1970s.
India’s Growing Emissions
The data also show that India’s total emissions have already surpassed those of Europe on an absolute level.
India:
Per Capita Emissions: 2.2 tonnes
Total Emissions: 2.94 billion tonnes
Given its large population and rapid economic growth, India could potentially see a rise in emissions similar to China’s recent history. The question then arises: Will we witness a similar CO2 explosion with the rise of India?
What does the IEA expects now as global CO2 emission for the 2030?
Global CO2 Emissions in 2030
Total Global Emissions (projected for 2030): The IEA projects that global CO2 emissions could peak around 2025 and then start to decline. By 2030, total emissions are projected to be approximately 32-33 billion tonnes if significant emission reduction measures are implemented globally.
Contributions from Major Emitters in 2030
China: Expected to peak around 11.6 to 11.8 billion tonnes by 2030.
USA: If the USA reduces emissions by 5% annually from 2024, emissions will be approximately 3.79 billion tonnes by 2030.
European Union: Targeting to reduce emissions to 2.46 billion tonnes by 2030.
India: Projected to have emissions around 3.8 to 4.1 billion tonnes by 2030.
32-33 billion tonnes of CO2 emissions globally mean that there is no reduction between 2010 and 2030 and the RCP 2.6 scenario is definitely history.
Let’s come back to this diagram again:
If emissions stagnate at 33 billion tonnes until 2033 and then begin to slowly decline, the pathway would be more aligned with the RCP 4.5 or RCP 6.0 scenarios. These scenarios assume delayed peak and gradual declines in emissions, reflecting slower and less aggressive mitigation efforts compared to RCP 2.6.
RCP 4.5: A stabilization scenario where emissions peak around 2040 and then decline, aiming for a concentration of around 650 ppm CO2-equivalent by 2100. This scenario assumes intermediate levels of greenhouse gas mitigation.
What are the implications of RCP 4.5?
Temperature Rise: Aligning with RCP 4.5 or RCP 6.0 would likely result in a global temperature increase of approximately 2.5°C to 3°C by the end of the century. This is higher than the targets set by the Paris Agreement, which aims to limit warming to well below 2°C, preferably to 1.5°C.
Climate Impact: Higher temperature increases would lead to more severe climate impacts, including extreme weather events, sea-level rise, and disruptions to ecosystems and human societies (refer as well to: https://chrisfaustulus.com/2023/10/02/tip-overgame-over/#oecd).
So, you may finally ask why I call this blog 95%? With my name, I can announce any fist rule or fist number. I assume that we fail miserably in handling the climate crisis by 95%. But still, I see at least a chance that we can get off more cheaply, but only with a chance by 5%, but never we will come out of this ecological crisis without paying a high price.
In 23, the sea surface temperature really jumped up far over the two sigma deviation of the long-term mean from 1982 to 2011. We are talking about +0.5 degrees over the plus 2 sigma deviation, so one degree over the long-term mean of 1982-2011. The science is quiet and concerned about this “effect”. They cannot explain why suddenly such an increase in the sea surface temperature is given. They go back to their models to figure out what they missed, but definitely it is not a good sign. Such high sea surface temperatures also explain, why you get such a curve:
You see for 23 a tremendous loss of ice recovery at the south pol in the winter period of the Southern Hemisphere. As water has a much higher temperature capacity than air, the water temperature won’t get down so easily, and that’s terrible news for the corrals in the seas (https://chrisfaustulus.com/2024/04/17/das-leiden-in-den-meeren/). This will have a tremendous bad impact on the global food chain. Moreover, Corrals are critical for coast protection because they act as natural barriers that reduce wave energy and erosion, thus protecting shorelines from storm surges and coastal degradation. In combination with stronger and stronger getting storms, that is a horrible combination. So I assume that this will be the first tipping point that will fall (and it has been tipping already quite a while). It is not that spectacular, like the interruption of the AMOC (https://chrisfaustulus.com/2024/02/29/the-amoc/) but very effective because this tipping over happens quietly under the sea and the damages on the food chain take time until we really recognize them, and so we will act again too late.
You might ask why I then see anyhow a 5% chance of improvement?
While the Earth’s existence is not in question, the quality of life and the stability of ecosystems are at significant risk. By taking radical, collective action, we can mitigate the worst impacts of climate change and give our planet the chance to recover. This approach requires unprecedented global cooperation and a willingness to prioritize the long-term health of our environment over short-term economic gains.
If we treat the Earth as a patient in need of critical care, we might just be able to stabilize the situation and ensure a livable planet for future generations.
So what chance do I see that we could avoid the worst development seen from current perspective in 2024? Let’s treat our planet as a very sick patient that should be put into a coma to give the Earth rest to recover.
What this could look like?
The Crisis Mode
1. Global Economic Shutdown:
Immediate Halt: A coordinated international agreement mandates a halt to non-essential economic activities. Industries, transportation networks, and non-critical services are paused.
Essential Services: Only critical activities such as food production, healthcare, and basic utilities remain operational. These sectors operate under strict environmental guidelines to minimize emissions.
2. Renewable Energy Transition:
Massive Investment: Governments and private sectors redirect funds to accelerate renewable energy projects. Solar, wind, and hydroelectric power installations receive unprecedented support and fast-tracked approvals.
The IEA (not the global green parties of the planet) tells: Investment in clean energy needs to increase significantly, particularly in emerging and developing economies, where investment must rise by more than five times by 2030 to meet the Paris Agreement/ RCP 2.6.
Research and Development: Increased funding for R&D in energy storage, grid modernization, and sustainable technologies to ensure a resilient renewable energy infrastructure.
3. Emission Reduction Measures:
Strict Regulations: Enforce stringent emission controls on the remaining operational sectors. Implement carbon capture and storage (CCS) technologies where feasible.
Carbon Tax: Introduce a high carbon tax to disincentivize any remaining fossil fuel use and generate revenue for climate initiatives.
4. Public Adaptation and Support:
Community Engagement: Mobilize communities to support local food production, energy-saving practices, and sustainable living. Encourage urban farming and local supply chains.
Education Campaigns: Launch global campaigns to educate the public on the importance of the measures, climate change impacts, and how they can contribute to the transition.
5. International Cooperation:
Unified Response: Countries collaborate to share resources, technology, and knowledge. Wealthier nations support developing countries in adopting renewable technologies.
Global Governance: Establish a global climate council to oversee and coordinate efforts, ensuring equitable distribution of resources and adherence to climate goals.
Implementation Plan
Phase 1: Preparation (0-6 months)
Assess and prioritize essential services.
Develop and disseminate guidelines for the shutdown and renewable transition.
Initiate funding reallocation and R&D efforts.
Phase 2: Shutdown and Transition Kickoff (6-24 months)
Enforce the shutdown of non-essential sectors.
Ramp up renewable energy projects and infrastructure upgrades.
Implement emission reduction measures and carbon tax.
Phase 3: Stabilization and Adaptation (24-60 months)
Monitor and adjust the shutdown measures based on environmental impact and societal needs.
Continue expanding renewable energy capacity.
Foster public adaptation through ongoing education and community support initiatives.
Gradually reintroduce economic activities under new, sustainable frameworks.
Ensure ongoing global cooperation and compliance with climate goals.
Maintain and enhance renewable energy systems and environmental protections.
The “climate coma” scenario requires unprecedented global cooperation, significant investment in renewable energy, and a societal shift towards sustainable living. While drastic, these measures are essential to avert the worst impacts of the climate crisis and secure a livable planet for future generations. The success of this scenario hinges on our collective will to act decisively and prioritize the Earth’s health over short-term economic gains.
If you look at the last part, you will agree that my 5% estimation for less critical climate scenario is a very positive estimation. We have been falling back to big wars, are on the brink even of a potential global war, why we should suddenly cooperate?
I see a short window at the beginning of the 30ties of this century. In this period, weather impacts can already be so drastic that a global majority of people recognize that such “climate coma” is the last chance to avoid the worst scenarios.
Probably I should lower this chance to five per mill, but I don’t do it to keep my faith up for tough times that are ahead of us and I ask kindly anyone who has managed to read the blog until here, please do everything to increase the 5%.
Als Landbewohner dieses Planeten ist es nicht verwunderlich, dass wir nicht so richtig mitbekommen, was in den Meeren sich so abspielt. Die meisten, zu denen ich mich natürlich auch zähle, bekommen das Meer als toten Fisch auf den Teller serviert, wo sie einem mit ihren großen Augen anschauen und man alles versucht ihren Gräten zu entgehen, um an ihr zartes, schmackhaftes Fleisch zu kommen, am besten mit einem guten Wein dabei. Andere Menschen bevorzugen das Fischstäbchen, das ist halt Geschmackssache.
Dass es insgesamt wärmer geworden ist auf unserem Heimatplaneten, das wird insbesondere älteren Menschen, z.B. Ende 50+, sehr deutlich und so verschieden, wie die Menschen sind, so haben sie verschiedene Erklärungen dafür. Ich gehöre zu denen, die den Menschen als Ursache ausgemacht haben. Aber wenn es auf dem Land global wärmer geworden ist, dann sollten die Meere auch wärmer geworden sein, alles andere wäre schwer zu verstehen. Jedoch bevor das Meer effektiv wärmer wurde, ich erinnere 2023 wurden vor den Küsten Floridas bis 80 Meter Tiefe eine Wassertemperatur von 38° Celsius gemessen, ist etwas anderes in den Meeren passiert: Sie wurden immer saurer.
Wie kann das sein und da kommt leider wieder dieses vermaledeite CO₂ ins Spiel! CO₂ + Wasser ergibt Kohlensäure, wir kennen es aus unseren geliebten und gekühlten Getränken im Kühlschrank. Beim Öffnen der Flasche, das Zischen, bevor wir noch trinken, erschaudern wir vor Erleichterung und kühlen mindestens um 2° Celsius ab. Bedauerlicherweise ist dieser Effekt nicht auf die Atmosphäre und Meere dieses Planeten anwendbar.
Die Versauerung der Meere ist miserabel, für die Flora und Fauna in den Meeren. Denn ganz viele Meereslebewesen bestehen aus einer wohlgeformten Kalkschale. So haben australische Forscher schon 2009 festgestellt, dass weitverbreitete Planktonorganismen, die Foraminiferen, sehr viel dünnere Kalkschalen als früher haben. (https://www.spiegel.de/wissenschaft/natur/versauerung-der-ozeane-kalkschalen-von-meeresbewohnern-werden-immer-duenner-a-612188.html). Dass eine Schwächung von Planktonorganismen keine gute Nachricht ist, auch wenn wir Menschen sie wohl eher selten direkt zu uns nehmen, sollte klar sein. Wir stehen eben nicht am Anfang, sondern am Ende der Nahrungskette.
Nun könnte man meinen, ein wärmeres Meer könnte ja auch ein Vorteil für die Meeresbewohner sein, denn je wärmer das Wasser, umso weniger kann es Kohlensäure binden, deswegen stellen wir ja u.a. die Getränke in den Kühlschrank. Tatsächlich steigt der Säuregehalt in den Meeren nicht mehr, aber er sinkt auch nicht, sondern verharrt auf einem hohen Sättigungsniveau.
Zudem sind auch erhöhte Meerestemperaturen für viele Meeresbewohner, z.B. Korallen, eine schlechte Nachricht. Bekannt ist dieser Effekt durch die seit Jahren auch in den Medien weit transportierte Situation im Great Barrier Reef vor Australien.
Warmes Wasser verstärkt die Korallenbleiche hauptsächlich durch den Stress, den es auf die Korallen ausübt. Korallen leben in einer symbiotischen Beziehung mit mikroskopisch kleinen Algen, bekannt als Zooxanthellen, die in ihren Geweben leben. Diese Algen sind entscheidend für das Überleben der Korallen, da sie durch Fotosynthese Nährstoffe produzieren, von denen die Korallen abhängen.
Wenn die Wassertemperatur jedoch über die für Korallen tolerierbaren Grenzen steigt, wird dieser fein abgestimmte symbiotische Prozess gestört. Die erhöhten Temperaturen führen dazu, dass die Korallen die Zooxanthellen ausstoßen, was oft als „Bleichen“ bezeichnet wird, weil die Korallen ihre Farbe verlieren und weiß erscheinen. Ohne diese Algen verlieren die Korallen eine wichtige Nahrungsquelle und sind mehr Stress ausgesetzt, was ihre Widerstandsfähigkeit gegenüber Krankheiten verringert und letztendlich zu ihrem Absterben führen kann, wenn die hohen Temperaturen anhalten.
Das Bleichen ist nicht sofort tödlich, aber wenn die Korallen nicht in der Lage sind, neue Algen in ihre Gewebe aufzunehmen, nachdem die Wassertemperaturen wieder normale Werte erreicht haben, können sie langfristig sterben. Das ist besonders problematisch, weil Korallenriffe eine enorme ökologische Bedeutung haben, als Lebensraum für tausende marine Arten dienen und Küstenregionen vor Erosion schützen.
Die Auswirkungen dieser Bleichereignisse sind besonders verheerend, da sie die ökologische Stabilität der Riffe untergraben und die Nahrungsnetze, die von diesen Ökosystemen abhängen, stark beeinträchtigen können. Korallenriffe bieten Lebensraum für eine Vielzahl von Meeresarten und sind zudem wichtig für den Küstenschutz und die lokale Fischereiwirtschaft. Die fortschreitende Bleiche der Korallen könnte somit nicht nur ökologische, sondern auch sozioökonomische Krisen nach sich ziehen.
Wissenschaftler haben beobachtet, dass die Meeresströmungen, sowohl die warmen als auch die kalten, stärker als gewöhnlich erwärmt sind, was zu einem beschleunigten Wärmetransport von den Tropen zu den Polregionen führt. Dies wiederum verstärkt die polare Eisschmelze und trägt zu einer zunehmenden Schichtung der Ozeane bei, was die Situation weiter verschärft (positive Feedback).
In Bezug auf Gegenmaßnahmen wird empfohlen, umfassende Schutzmaßnahmen einzuführen, darunter aktive Restaurierungsprojekte, die Anpassung der Korallen an steigende Temperaturen, und vor allem die Reduzierung von Treibhausgasemissionen. Diese Maßnahmen sind entscheidend, um die Widerstandsfähigkeit der Korallen gegenüber den steigenden Temperaturen zu verbessern und langfristig ihre Überlebensfähigkeit zu sichern.
Da bleibt mir noch zu erwähnen, dass die OECD, übrigens keine Umweltorganisation, im Jahr 2022 das Absterben der Korallen in den Meeren als einen globalen, ökologischen Kipppunkt von weiteren vier globalen Kipppunkten identifiziert hat.
Mir scheint, es könnte der erste, aber nicht der letzte Kipppunkt werden.
This blog was created by using AI System ChatGPT 4.0.
The Reason for this blog post is the latest findings of the climate researchers: James Hansen, Makiko Sato, Pushker Kharecha.
James E. Hansen is renowned in climate research for his early warnings about global warming, notably his 1988 testimony before the U.S. Congress, which brought the issue of climate change to widespread public attention. As a former director of the NASA Goddard Institute for Space Studies, his pioneering work in developing and using climate models to predict climate change impacts has made him a central figure in environmental science and advocacy.
In the quest to understand and combat climate change, voices like that of James E. Hansen, a leading climate researcher, are invaluable. Hansen’s recent comments shine a light on the complexities of global warming and challenge us to rethink our strategies for the future.
The researches see in their analyzed global temperature data an acceleration of the temperature growth on decades level:
Here’s what you need to know, broken down into more digestible pieces, why we see this development according to James E. Hanson and others.
The Current Climate Dilemma
Imagine our planet like a patient in a delicate state of health, with human activities tipping the scales towards fever. Hansen points out that we’ve been underestimating two critical factors in this equation: how sensitive our planet is to increases in greenhouse gases, and how much cooling aerosols (tiny particles in the air) have been helping us by offsetting some of the warming. It’s akin to realizing a fever is higher than the thermometer initially indicated.
Clean air is essential for our health, but paradoxically, reducing air pollution can temporarily accelerate global warming by removing aerosols that help cool the Earth. However, intentionally polluting to cool the planet is not a solution; we must focus on sustainable ways to reduce greenhouse gases without compromising air quality.
The Issue with Current Climate Models
Our global efforts to predict and mitigate climate change have leaned heavily on complex simulations known as Global Climate Models (GCMs). While incredibly sophisticated, Hansen argues these models miss the mark by not accurately accounting for the full effects of aerosols and the Earth’s sensitivity to greenhouse gases. It’s like using an outdated map to navigate a rapidly changing landscape.
What’s at Stake?
The ramifications of underestimating these factors are profound. Preserving the world as we know it, including our coastlines, ecosystems, and the global climate itself, may require us to do more than just halt global warming—we might need to reverse it. Yet, the path forward is unclear, muddied by optimistic policies that overlook the pressing energy needs and goals of burgeoning economies around the world.
A Call for Action
Hansen’s critique is a clarion call for a new direction. He urges us to move beyond wishful thinking and to adopt a more realistic approach to climate science—one that accurately reflects the nuances of our planet’s climate system and informs more effective strategies for mitigating climate change.
So, what can we do? Here are a few takeaways:
Enhance Climate Models: We need better data incorporation and understanding of climate sensitivity and aerosol impacts.
Cut Down on Emissions: It’s imperative to drastically reduce greenhouse gas emissions through renewable energy, energy efficiency, and moving away from fossil fuels.
Innovate and Adapt: Investing in carbon capture technologies, sustainable infrastructure, and global policies that genuinely address the scale of the problem.
Educate and Mobilize: Raising awareness and fostering a society that understands the stakes and is committed to sustainable living and policymaking.
The Path Forward
James E. Hansen reminds us that the journey toward a sustainable future is fraught with challenges and complexities. Yet, he also reiterates the possibility of a brighter future for the next generations. The solutions require not only scientific innovation and political will, but also a global acknowledgment of the shared responsibility we hold.
Anmerkung: Dieser Blog wurde auch mithilfe künstlicher Intelligenz (ChatGPT 4.0) erstellt.
Zu einem, der sich nicht mit dem Klimawandel, resultierend aus einer “Business as usual” Haltung, abgeben will, ist sicherlich der Astrophysiker und Naturphilosoph Harald Lesch zu zählen. Vor einigen Jahren schrieb er auch dazu das Buch: “Wenn nicht jetzt, wann dann?“
Wer über die Jahre hinweg Harald Lesch – oder Harry, wie er in seinen Fankreisen liebevoll genannt wird – und sein Engagement beim Thema Klimawandel verfolgt hat, wird leider seine wachsende Verzweiflung zu diesem Thema bemerkt haben.
Das “Business as usual Konzept” gegenüber dem Klimawandel lautet: “Was ich nicht weiß, macht mich nicht heiß!”
Harald Lesch als Physiker und Naturphilosoph kann sich nicht hinter solch einer Unwissenheit “verstecken”. Dementsprechend merkt man ihm recht offensichtlich seine steigende Besorgnis an.
In dem am Ende des Blogs verlinkten Beitrag von Harald Lesch und Dr. Cecilia Scorza werden viele, auch aus meiner Sicht, dramatische Aspekte des zurzeit beobachtbaren Klimawandels mit seinen künftigen Entwicklungen betrachtet, die wahrscheinlich zu viele gar nicht einordnen können.
Ich möchte zwei Aspekte aus diesem komplexen Thema herausgreifen: Zum einen, warum ist gerade das Spurengas CO2 so ein Problem geworden für uns und alle anderen Lebewesen auf diesem Planeten und warum können wir sicher sein, dass der zweifelsfrei messbare Anstieg des CO2 Gehalts in unserer Atmosphäre auch tatsächlich von uns, den Homo sapiens stammt?
Um den Effekt, den CO2 auf unseren Planeten hat, zugänglicher zu machen, vergleiche man die Erde mal mit etwas Alltäglichem: einer Thermoskanne.
Stellen wir uns vor, die Erde wäre eine riesige Thermoskanne. Eine Thermoskanne hält Ihren Tee warm, indem sie verhindert, dass die Wärme entweicht. In unserem Fall spielt das CO2 in der Atmosphäre die Rolle der Thermoskanne für die Erde.
Das CO2-Molekül ist besonders, weil es nicht starr ist. Es kann sich bewegen, fast so, als ob es tanzen würde. Es gibt verschiedene Tanzbewegungen, die das Molekül ausführen kann: Es kann sich dehnen, also länger und kürzer werden, oder es kann sich neigen, sich hin und her wiegen. Diese Bewegungen sind wichtig, weil sie dem Molekül ermöglichen, mit Licht zu interagieren, genauer gesagt mit Infrarotlicht, das wir als Wärme wahrnehmen.
Wenn die Sonnenstrahlung die Erde erreicht, wird ein Teil dieser Energie in Form von Wärme (Infrarotstrahlung) zurück ins Weltall reflektiert. Hier kommt das tanzende CO2 ins Spiel: Aufgrund seiner Beweglichkeit kann es die Wärme (Infrarotlicht) einfangen. Jedes Mal, wenn ein CO2-Molekül mit einem Infrarotlichtstrahl kollidiert, absorbiert es einen Teil der Energie und hält diese sozusagen gefangen. Dann strahlt es diese Energie wieder aus, ein Teil davon geht ins Weltall, aber ein Teil wird auch zurück zur Erde gesendet. Das führt dazu, dass mehr Wärme innerhalb unserer “Thermoskanne” Erde bleibt.
Je mehr CO2 in der Atmosphäre ist, desto mehr Wärme kann gehalten werden. Das ist vergleichbar mit dem Hinzufügen einer zusätzlichen Isolationsschicht zu unserer Thermoskanne. Dies führt dazu, dass die Temperatur auf der Erde steigt, was wir als globale Erwärmung kennen.
Die Interaktion zwischen Lichtteilchen (Photonen) und dem CO2 Molekül ist sehr gut in diesem Gif dargestellt von der “University of Colarado Boulder”: https://phet.colorado.edu/
Physikalisch wird für wenige Mikrosekunden das CO2 Molekül ein Teil der Infrarotstrahlung. Das CO2 wandelt die eingehende Energie der Wärmestrahlung in mechanische Schwingungen um, die mit der gleichen Frequenz schwingen, wie die Frequenz der elektromagnetischen, thermischen Strahlung. Die Außenelektronen des Kohlenstoffatoms und der Sauerstoffatome können in diesen Mikrosekunden einen höheren Energiezustand erreichen, aber wie im wahren Leben sind sie froh, wenn sie wieder ernüchtert im Grundzustand sind und dabei geben sie ihre überschüssige Energie in Form von Wärmestrahlung (Abgabe eines Photonenteilchens) ab mit der gleichen Frequenz (Energie) wie die ursprüngliche anregende Strahlung. Nur und das ist jetzt das entscheidende, die Richtung der einfallenden Strahlung auf das Molekül wird bei der “Weiterleitung” der Strahlung verändert (siehe oben).
Auch hervorragend dargestellt ist das in dieser Simulation:
Wenn man sich die Treibhausgase anschaut, dann fällt auf, dass sie alle ungeradzahlige Anzahl von Atomen haben. Diese ungerade Anzahl von Atomen in den Molekülen ermöglicht Asymmetrien bei Schwingungszuständen der Moleküle, die wiederum machen die Moleküle zu temporären elektrischen Dipolen, die mit thermischer, elektromagnetischer Strahlung wechselwirken kann. Und das ist gut so. Denn ohne diesen Mechanismus wäre es für Leben viel zu kalt auf diesem Planeten. Die globale Durchschnittstemperatur auf der Erde betrüge dann nur -15 Grad Celsius, das ist definitiv zu kalt für Leben. Ausrechnen kann man das über das Plancksche Strahlungsgesetz zum schwarzen Körper.
Aber die Dosis macht das Gift. Als Harald Lesch 1960 in die Welt trat, da betrug die CO2-Konzentration 320 ppm (ppm = parts per million). Heute sind wir bei 420 ppm. Was bedeutet “parts per million”? Wenn man heute eine Million Luftmoleküle einsperrt, dann sind davon ganze 420 Moleküle ein CO2 Molekül. Die zu finden in den eine Million Molekülen ist verdämmt schwierig. Man kann es tun, es ist technisch möglich, aber eben sehr aufwendig. Wenn wir es täten, dann empfänden wir den heutigen Spritpreis als ein Schnäppchen, also lassen wir es und warten auf Godot.
Ein CO2 Konzentration von 420 ppm entspricht einem Anstieg gegenüber dem höchsten natürlichen vorindustriellen Niveau bei 300ppm in den letzten 800.000 Jahren von 40% und das hat folgen (siehe auch folgende Grafik zur CO2-Konzentration über die letzten 800.000 Jahre, die aus dem Jahre 2021 stammt, Quelle: NOAA).
Können wir nun sicher sein, dass dieser enorme Anstieg des CO2 Gehalts wirklich durch Verbrennung von fossilen Brennstoffquellen, zumeist für industrielle Fertigung und Fortbewegung zurückzuführen ist? Schließlich emittieren wir beim Atmen zusammen mit unseren lieben Rindern und Schweinen CO2 beim Ausatmen und wenn der Furz mal quer sitzt.
In der Atmosphäre gibt es im Fall von Kohlendioxid (CO2) tatsächlich Unterschiede. Nicht jedes CO2 Molekül ist identisch aufgebaut.
CO2 kann durch viele Prozesse in die Atmosphäre gelangen, wie zum Beispiel durch Atmen, Verwesung oder Verbrennung von Biomasse, was man als “neues” CO2 betrachten könnte.
Dieses “neue” CO2 enthält einen Mix aus verschiedenen Kohlenstoffisotopen, einschließlich C-14, einem radioaktiven Isotop, das natürlich in der Atmosphäre vorkommt und eine Halbwertszeit von etwa 5.730 Jahren hat (nicht 75 Jahre, was ein häufiger Irrtum ist. Auch Harald Lesch irrt manchmal, aber sehr selten). Durch kosmische Strahlung wird ständig neues C-14 erzeugt, wodurch ein ungefähr konstantes Verhältnis von C-14 zu den anderen Kohlenstoffisotopen in lebenden Organismen und der Atmosphäre aufrechterhalten wird.
Wenn nun Pflanzen durch Fotosynthese CO2 aufnehmen, integrieren sie dieses Verhältnis von C-14 in ihre Struktur. Tiere nehmen durch den Verzehr dieser Pflanzen ebenfalls C-14 auf. Sobald jedoch ein Organismus stirbt, hört er auf, C-14 aufzunehmen, und das vorhandene C-14 beginnt zu zerfallen. Nach etwa 5.730 Jahren hat sich die Menge des C-14 im toten Material halbiert. Fossile Brennstoffe wie Kohle und Öl, die aus Überresten von Pflanzen und Tieren entstanden sind, die Millionen von Jahren tot sind, haben praktisch kein C-14 mehr.
Wenn wir fossile Brennstoffe verbrennen, geben wir CO2 in die Atmosphäre ab, das kein C-14 enthält. Im Vergleich zu dem “neuen” CO2, das durch Prozesse wie Atmen und Verwesung entsteht, lässt sich also sagen, dass das CO2 aus fossilen Brennstoffen wie ein altes Foto ohne Datum ist – es fehlt das “radioaktive Produktionsdatum”, das C-14.
Über die letzten Jahrzehnte hinweg haben Wissenschaftler beobachtet, dass der Anteil von C-14-freiem CO2 in der Atmosphäre zugenommen hat, was ein deutlicher Hinweis darauf ist, dass die Zunahme der CO2-Konzentrationen vor allem auf die Verbrennung fossiler Brennstoffe zurückzuführen ist. Dieses Verständnis hilft uns, die menschliche Rolle beim Klimawandel besser zu begreifen, da es zeigt, dass der Anstieg der CO2-Konzentrationen nicht einfach ein natürlicher Teil des Kohlenstoffkreislaufs ist, sondern eine direkte Folge menschlicher Aktivitäten.
Da beißt die Maus keinen Faden ab, wir haben und emittieren weiterhin seit den 60zigern Giga Tonnen von CO2 pro Jahr in die Atmosphäre, unsere, ähnlich wie die Meere, globale Müllhalde.
Um eine globale Erderwärmung auf 1,5 bis 2 Grad Celsius gegenüber der vorindustriellen Zeit zu halten, müssten wir Anfang der kommenden Dreißigerjahren auf 20-25 Gigatonnen CO₂ Emission zurückfahren und in den folgenden 20-30 Jahren auf Zero zurückrudern. Wer genau auf obige Grafik schaut, dem fällt auf, dass es der Menschheit gelang, die CO2-Emissionen am Höhepunkt der COVID-19 Pandemie zurückzufahren auf 35 Giga Tonnen.
Ich persönlich glaube nicht, dass wir allein mit der Konversion zu grünen Energien, die ich sehr befürworte, es schaffen werden, die globale Erwärmung unter 2 Grad Celsius zu halten. Aber alles, was aber über zwei Grad Celsius liegt, wird in der Wissenschaft als sehr gefährlich für die Menschheit angesehen. Wir werden daher über obige CO2 Emissionskurve noch zu sprechen kommen.
Ich teile zumindest die Ansichten von Harald Lesch zum Thema Klimawandel und alles, was damit zusammenhängt.
On the 25th of July in 2023, a scientific article by the Danish scientist couple Susanne and Peter Ditlevsen drew for some days a higher attention in the media, at least for media and private people concerned about the climate change development.
I asked ChatGPT to read the article and asked for help to understand this complex matter. Here is ChatGPT’s first overview of the paper:
The paper you’ve shared, authored by Peter Ditlevsen and Susanne Ditlevsen, provides a detailed analysis of the Atlantic Meridional Overturning Circulation (AMOC) and its potential collapse by mid-century under current emission scenarios. Here’s an overview of the key points:
AMOC’s Importance: The AMOC is a critical part of the Earth’s climate system, influencing climate patterns in the North Atlantic region. Its collapse could lead to severe climate impacts.
Current Status and Predictions: While the Intergovernmental Panel on Climate Change (IPCC) has suggested that a full collapse of the AMOC is unlikely within the 21st century, this paper presents a more alarming view based on the detection of early-warning signals (EWS) such as increased variance and autocorrelation, indicating a loss of resilience and a critical slowing down of the AMOC.
Methodology: The paper describes a novel statistical method to estimate the timing of the AMOC collapse by analyzing changes in mean, variance, and autocorrelation of the AMOC’s strength, without assuming a specific control parameter. This method involves stochastic modeling and statistical analysis to predict the collapse around mid-century, with a 95% confidence interval.
Findings: The analysis suggests a significant risk of AMOC collapse between 2025 and 2095, with a high probability of occurrence by 2057. This prediction is based on a data-driven approach and statistical significance, providing a more robust assessment than previous models.
Implications: The potential collapse of the AMOC underscores the urgency of addressing climate change and reducing greenhouse gas emissions. The paper emphasizes the importance of monitoring the AMOC and its early-warning signals to better predict and mitigate future climate risks.
This paper contributes significantly to our understanding of AMOC dynamics and the potential risks of its collapse, highlighting the need for immediate action to prevent severe climate impacts.
To coin it in scientific terms, I am quite confident that I won’t see the year 2057 personally, so why I care?
Two reasons: firstly, the couple Ditlevsen forecasts already 2025 onwards a chance that the AMOC breaks down, and secondly I hope my son will be alive in 2057.
But before we dive deeper in the understanding why a collapse of the AMOC could happen already in 21st century, let’s understand what the AMOC is:
ChatGPT:
The Atlantic Meridional Overturning Circulation (AMOC) is a large system of ocean currents that plays a crucial role in regulating the Earth’s climate, particularly in the North Atlantic region. Think of it as a giant conveyor belt in the ocean that moves warm water from the tropics towards the North Atlantic, where the water cools, sinks, and then flows back towards the equator and further on to the southern hemisphere. This process is driven by differences in water temperature and salinity, which affect the water’s density.
Why is the AMOC Important?
Climate Regulation: The AMOC helps distribute heat around the planet. By transporting warm water northward, it moderates the climate of Northern Europe and parts of North America, making these regions warmer than they would otherwise be at such latitudes.
Weather Patterns: It influences weather systems, particularly in the Atlantic, affecting rainfall patterns, storm paths, and the frequency and intensity of hurricanes.
Marine Ecosystems: The AMOC impacts marine ecosystems by moving nutrients around, supporting diverse marine life in both the deep and surface ocean layers. This has significant implications for fisheries and the broader marine food web.
Carbon Cycle: The circulation plays a key role in the global carbon cycle by transporting carbon dioxide from the atmosphere into the deep ocean, thus acting as a carbon sink and influencing the Earth’s carbon balance.
Global Climate System: The AMOC is interconnected with other parts of the global climate system, including the atmosphere and ice caps, meaning changes in the AMOC can have wide-reaching effects beyond just the Atlantic.
In summary, the AMOC is crucial for maintaining the climate we are accustomed to, supporting marine ecosystems, and regulating global climate dynamics. Disruptions or significant changes in the AMOC could lead to dramatic shifts in climate patterns, with wide-ranging impacts on weather, sea levels, and biodiversity, affecting societies and ecosystems around the globe.
The AMOC is very frequently described as a conveyor belt for transporting salt and heat through the oceans, here how it works in principle.
ChatGPT:
Heat Transportation:
Warm Start: The journey begins in the tropical regions of the Atlantic Ocean, where the sun’s heat is strongest. Here, the ocean water warms up significantly, making it lighter and causing it to stay on the surface.
Northward Journey: This warm, surface water then travels northward along the coast of North America towards Europe. As it moves, it carries the tropical warmth with it, like a massive, gently flowing river in the ocean.
Cooling Down: When this warm water reaches the North Atlantic, near Greenland and the Arctic, the colder surroundings cool it down. Cold water is denser than warm water, so as the surface water cools, it starts to sink.
Salt Transportation:
Evaporation: In warmer regions, some of the ocean water evaporates due to the heat, leaving behind salt. This makes the water saltier and denser.
Mixing and Sinking: As the water travels north and cools, it not only becomes denser from losing heat, but also from the saltiness left behind by evaporation. This extra density from the salt helps the water sink even deeper when it cools.
The Deep Return:
Deep Ocean Current: Once the water has sunk, it creates a deep ocean current that flows back towards the equator and further into the Southern Hemisphere. This deep, cold, and dense water makes its way around the globe in the deep ocean, eventually mixing with warmer waters and rising back to the surface in a process that can take hundreds of years.
Completing the Loop: As the deep water warms up and rises, it becomes less dense and starts its journey back to the surface, eventually warming up in the tropical regions and starting the cycle over again.
This continuous movement of warm and salty water towards the poles and cold water towards the equator creates a global circulation system, distributing heat and regulating climate around the world. It’s like a giant, natural thermostat that helps keep our planet’s climate in balance.
So even if you are, like me, no oceanographer nor climate scientist nor something related, you understand this conveyor belt is “somehow” important for us.
Again, before we try to understand why a forthcoming AMOC collapse in this century could appear, we should realize that the AMOC has already collapsed in ancient epochs several times:
ChatGPT:
The AMOC has experienced significant changes, including collapses, during Earth’s history, particularly during ancient epochs. These events are fascinating because they give us clues about how Earth’s climate system works and how it can change. Here’s a simplified explanation:
Ancient Epochs and AMOC Changes:
Ice Ages and Warm Periods: Throughout Earth’s history, there have been cycles of ice ages (glacial periods) and warmer intervals (interglacial periods). During these times, the AMOC has shown significant variations in strength and pattern.
Rapid Changes: Evidence from ancient sediments, ice cores, and other geological records shows that the AMOC can change rapidly, within a span of a few years to decades, leading to significant climate shifts. These rapid changes are often linked to sudden releases of freshwater into the North Atlantic, which can disrupt the delicate balance of the ocean’s salt and heat transport.
Effects of AMOC Collapses:
Cooling Events: When the AMOC weakens significantly or collapses, it can lead to rapid cooling in the North Atlantic region. This is because the warm, tropical waters are no longer being transported northward effectively, reducing the warming effect on these regions.
Climate Shifts: Such collapses have been associated with widespread climate changes, including cooler temperatures in Europe and North America, shifts in rainfall patterns, and even impacts on monsoons in Asia.
Past Examples: One of the most well-studied events is the Younger Dryas, a sudden cooling period about 12,000 years ago, which is thought to have been caused by a massive influx of freshwater from melting ice sheets into the North Atlantic, disrupting the AMOC.
Why It Matters:
Studying these ancient events helps scientists understand the potential impacts of current and future changes in the AMOC due to human-induced climate change. It provides a context for what might happen if the AMOC were to weaken or collapse in our time, emphasizing the importance of monitoring and understanding this critical component of Earth’s climate system.
In summary, the AMOC’s changes in the past have had profound effects on the global climate. By learning from these ancient episodes, scientists aim to better predict and mitigate potential future climate changes.
So now we have I think a comprehensive overview of the AMOC. Why the researchers Ditlevsen see a high chance of a collapse for the AMOC within this century?
ChatGPT
“This paper presents a more alarming view based on the detection of early-warning signals (EWS) such as increased variance and autocorrelation, indicating a loss of resilience and a critical slowing down of the AMOC.“
What is the meaning of “early-warning signals (EWS) such as increased variance and autocorrelation” in the context of a global conveyor belt of salt and heat within Earth’s oceans?
ChatGPT
The early-warning signals are about the tipping point that the global conveyor belt interrupts and to make it clear: If it interrupts, then it will be interrupted for a very long time because there is no way at all from the current point of view that humans can turn it on (we can only turn it off unfortunately).
The term “increased variance and autocorrelation” contains scary statistic measures which need to be explained:
ChatGPT
Increased Variance:
Variance refers to how much the values of a particular variable differ from the average value over a period. In simpler terms, if the variance is high, it means that the measurements of that variable (like temperature or current strength in the AMOC) are more spread out — they fluctuate more widely around the average. An increase in variance in the context of the AMOC suggests that its strength and behavior are becoming more unpredictable and less stable, which could indicate a system approaching a critical threshold or change.
Autocorrelation:
Autocorrelation is a measure of how similar the values in a sequence are to each other at different times. For instance, if the AMOC’s strength today is similar to its strength yesterday and the day before, the autocorrelation would be high. This measure helps in understanding the persistence of a condition over time. An increase in autocorrelation in the AMOC would suggest that whatever happens to the system at one time is increasingly likely to influence its state at a subsequent time, indicating a slowing down of the system’s dynamics. In other words, it means that it gets “tired” and it doesn’t react anymore to the embedded system environment so quickly. Hence, it is a sign of approaching a tipping point where significant and potentially abrupt changes could occur. This is critical because it implies that once near a tipping point, the system might not recover or adapt easily to external stresses, leading to more profound and lasting changes.
In this case, I think two simple sketches will explain the terms variance and autocorrelation in context to a tipping point even better:
Top diagram (Stable Variance): This diagram shows a ball in a wide, shallow valley, illustrating a stable situation where the AMOC can easily return to its equilibrium state despite disturbances. The wide shape of the valley represents the system’s resilience, where external influences are unlikely to push it out of balance. This stability ensures that the AMOC can recover quickly from disruptions, maintaining its crucial role in regulating Earth’s climate.
Bottom diagram (Higher Autocorrelation): Here, the ball is in a deep, narrow valley. In compare to the upper scenario, the ball is at a higher energy level (hint: climate change is an increase in energy in oceans and atmosphere). This represents the system being more affected by change, taking longer to return to a stable state after being disturbed. The high autocorrelation means that the current state of the system is heavily influenced by its previous states, indicating a “memory” effect that can be a precursor to a tipping point, as it may not respond quickly to further disturbances.
To measure the variance and autocorrelation of the AMOC, the scientists Peter Ditlevsen and Susanne Ditlevsen used advanced statistical techniques on temperature and salinity data collected from the ocean. Here’s a simplified explanation:
Data Collection: They gathered historical data that tracks changes in ocean temperature and salinity over time, which indirectly reflect changes in the AMOC.
Calculating Variance: They calculated the variance by determining how much the data points (temperature and salinity) deviated from their average values over time. This tells them how much fluctuation or instability is present in the AMOC.
Calculating Autocorrelation: They then measured autocorrelation by examining how closely related data points are with their previous values over time. High autocorrelation indicates that present conditions are heavily influenced by past conditions, suggesting a slowing down of the system’s dynamics.
The Ditlevsens used multiple sources of data for their analysis, typically involving oceanographic datasets that include measurements of temperature, salinity, and flow rates, collected from satellite observations, ocean buoys, and ship-based sampling. These datasets are essential for tracking the behavior and changes in the AMOC over time.
But as it is part of such a scientific paper, also the criticism of their study appeared soon.
ChatGPT
The scientific community has expressed varied reactions to the Ditlevsens’ article predicting a potential collapse of the AMOC. Some key points from experts include concerns about the data used, the assumptions made, and the models employed in their study.
Concerns About Proxy Data: Some critics point out that the Ditlevsens’ predictions rely heavily on proxy data from sea surface temperatures, which might not accurately reflect the true state of the AMOC. Continuous direct measurements of the AMOC have only been available since 2004, making long-term conclusions less certain (Science Media Centre).
Model Assumptions: The model assumptions have also been questioned. The Ditlevsens assume that the AMOC is bi-stable (having an “on” and “off” state) and can switch rapidly between these states. This bi-stable assumption is debated, with some suggesting that the AMOC might respond more smoothly to changes in the climate system. If the assumptions in their model are correct, the implications would indeed be profound; however, other plausible models might yield different conclusions.
Skepticism from Broader Climate Models: Some experts argue that the broader, more comprehensive climate models do not show the bifurcation (a sudden, drastic shift) suggested by the Ditlevsens. This has led to skepticism about the urgency and likelihood of an AMOC collapse as portrayed in the study.
Importance of Continued Monitoring: Despite these criticisms, there is a consensus on the importance of continuing to monitor the AMOC. Variability in its strength is crucial for understanding regional and global climates, and thus, even those critical of the study acknowledge the necessity of ongoing research and observation.
Overall, while the study by the Ditlevsens has sparked significant discussion and brought attention to the potential risks associated with changes in the AMOC, it also highlights the complexities and uncertainties involved in predicting such critical transitions in Earth’s climate system.
But the story does not end here. In February 2024, a Dutch research team published as well a scientific work about the AMOC: “Physics-based early warning signal shows that AMOC is on tipping course”. The scary thing is that they did it much more advanced and reliable in compare to the statistical approach of the Ditlevsens, but the outcome is pointing into the same direction at least.
Here, the details presented from ChatGPT 4.0 analyses:
The Dutch research team led by René M. Van Westen, Michael Kliphuis, and Henk A. Dijkstra conducted a comprehensive study focusing on the Atlantic Meridional Overturning Circulation (AMOC) and the potential for its collapse. Here’s an overview of their research as detailed in the document you provided:
Key Findings
Physics-Based Early Warning Signal: The team developed a new, physics-based early warning signal to detect the tipping point of the AMOC collapse. This signal is based on monitoring the minimum AMOC-induced freshwater transport at the southern boundary of the Atlantic.
AMOC Simulation: They conducted simulations using the Community Earth System Model (CESM), showing a gradual weakening of the AMOC under increasing freshwater forcing, which led to a simulated collapse after approximately 1750 model years.
Impact of AMOC Collapse: The study outlined significant climate impacts due to the AMOC collapse, such as dramatic cooling in the Northern Hemisphere and alterations in sea ice distribution and regional climates globally. This includes profound changes in temperature and precipitation patterns, affecting ecosystems like the Amazon rainforest.
Methodology
Modeling Approach: They used a quasi-equilibrium approach with added freshwater fluxanomalies in the North Atlantic, maintaining other climatic forcings at pre-industrial levels during the simulations.
Innovative Measurement: The researchers focused on the freshwater transport dynamics at 34°S as a critical indicator, emphasizing its role in the salt-advection feedback mechanism which is crucial in AMOC stability.
Significance and Novelty
This study is one of the first to identify an AMOC tipping event in a complex General Circulation Model (GCM) used for climate projections. Their findings suggest that traditional statistical early warning signals might not be sensitive enough and highlight the necessity for a more physics-integrated approach.
Critiques and Further Research
The simulation showed that while the traditional early warning indicators like increased variance and autocorrelation were not consistently reliable, the newly proposed physics-based indicators showed more promise in predicting AMOC’s behavior.
This research adds significantly to our understanding of AMOC dynamics and tipping points by integrating physics-based indicators, which could potentially offer more precise predictions and early warnings about AMOC’s future states. This advancement in modeling and warning systems is crucial for preparing for and potentially mitigating the severe climatic impacts of an AMOC collapse.
Remarks:
In climate modeling, “model years” typically refer to the passage of time within the simulation rather than actual calendar years. The starting point of a model can be any year, depending on the preindustrial or historical setup used, and the progression follows the conditions set by the experiment (like greenhouse gas concentrations, solar forcing, etc.). Therefore, stating that a collapse happens after 1750 model years doesn’t mean it predicts a collapse in the year 3750 AD; it indicates how long it takes after the initial conditions are set for the system to collapse under those specific simulated conditions.
Could a Collapse Happen This Century?
According to the findings from the Dutch research, they noted potential early warning signs and shifts within their simulations that could imply increased risks of an AMOC collapse under sustained or specific stresses like significant freshwater influxes. Real-world observations and other models have also suggested that while an AMOC collapse this century is possible, it is still considered unlikely. However, they do show that the AMOC is weakening, which aligns with concerns about its stability due to ongoing climate change.
The real-time risk of an AMOC collapse this century hinges on various factors, including the rate of global warming, ice melt rates, and changes in salinity and temperature gradients across the Atlantic. It’s a subject of active research, with different models providing varying timelines based on their specific parameters and scenarios.
The Dutch research team conducted their AMOC simulation using the Dutch National Supercomputer Snellius. This detail indicates the computational power required for such complex climate modeling. The procession of the simulation took about half a year.
Finally, we should take a look at this diagram:
The graph shows the daily sea surface temperature from 1981 to 2024 for a broad region of the world, tracking annual fluctuations and highlighting the mean temperature and standard deviations over this period. The apparent sharp increase in average temperature in 2023 and 2024 is particularly noticeable.
Interpretation of the Graph:
Annual Lines: Each gray line represents the sea surface temperature for a specific year, plotted daily.
Dashed Black Lines: These indicate the mean (average) sea surface temperature calculated from data spanning 1982 to 2011. The lines marked as “plus 2σ” and “minus 2σ” represent two standard deviations above and below the mean, respectively. This range indicates the typical variability in temperature expected due to natural fluctuations.
Orange Lines: The temperatures for 2023 and 2024 show a significant deviation above the historical average, especially in 2024, where the temperature remains consistently higher than the mean.
Potential Reasons for the Anomaly:
Climate Change: The most likely explanation for sustained increases in sea surface temperature is global warming driven by increased concentrations of greenhouse gases in the atmosphere. This trend aligns with global observations of rising ocean and atmospheric temperatures.
El Niño Events: These periodic climatic events can cause significant, temporary increases in sea surface temperatures across large areas of the Pacific Ocean, which can affect global weather and climate patterns. An El Niño event could explain a sudden spike in temperatures.
Changes in Ocean Currents: Shifts in major ocean currents could redistribute warm water differently, potentially explaining regional increases in sea surface temperatures.
And to make it clear, a slowdown of the AMOC, which we already see in the measurement data, can cause the following:
Heat Redistribution: The AMOC transports warm water from the tropics northward across the Atlantic, contributing to milder climates in Western Europe and affecting weather patterns across the Northern Hemisphere. If the AMOC slows down or alters its path, this could redistribute heat across the globe, potentially leading to increases in sea surface temperatures in other regions.
Climate Feedbacks: A weaker AMOC could lead to less heat being removed from the tropics and more remaining in the equatorial regions, which could increase global sea surface temperatures. Additionally, changes in the AMOC can impact sea ice, cloud cover, and atmospheric circulation patterns, all of which play roles in the global climate system and can further influence temperatures.
Interactions with Other Systems: The AMOC is also linked with other oceanic and atmospheric patterns, such as El Niño, the Southern Oscillation, and the Pacific Decadal Oscillation. Changes in the AMOC could exacerbate or modify the effects of these systems, leading to broader impacts on global climate.
This blog has been designed by myself, but it was improved by ChatGPT 4.0.
Introduction:
In today’s fast-paced digital age, accessing information should be as simple as having a conversation. Enter the innovative concept of a chat system that merges the capabilities of ChatGPT with Azure Cognitive Search, allowing users to “talk to their data.” This blog delves into this novel approach and its implications.
The Concept:
User Prompt: Everything begins with a user posing a question or input, just as they would in any chat environment.
ChatGPT 3.5:
Down scaling User Prompt: Before diving into data retrieval, the system efficiently processes and simplifies the user’s question, ensuring that it’s well-structured for searching.
Data Conversion: Once the Azure Cognitive Search fetches the relevant data, ChatGPT converts the search results into a comprehensible answer. This translation is versatile, adapting to both the language the query was made in and the language of the source data.
Azure Cognitive Search: The heart of our data retrieval system. This powerful tool digs through:
Structured Data: Databases, tables, and other organized repositories.
Unstructured Data: Such as files, images, documents, and more, ensuring no stone is left unturned.
Implications & Advantages:
Intuitive Interaction: The system feels like chatting with an expert who instantly fetches and decodes information from vast data reservoirs.
Language Agnostic: With ChatGPT’s capabilities, the system transcends language barriers, making it universally accessible.
Swift & Efficient: By interfacing directly with Azure Cognitive Search, the system ensures rapid data retrieval and response times.
Wrapping Up:
The seamless integration of ChatGPT with Azure Cognitive Search heralds a new era in data interaction. By allowing users to converse with their data, we’re not just enhancing the user experience; we’re redefining it.
That’s it really?
So as you can easily see, that was the marketing version of the “chat with your data system” but frankly spoken and that I say at thirty years of professional software development: If someone had told me in January 2023, that this can be enabled by really a few lines of Python code I would have ignored this person and probably asked him or her to consult the doctor.
But where is the catch, there must be one and luckily, there are a few, so that ordinary software application developers are still needed, at least for now ;-).
Firstly, we have to understand how Azure Cognitive Search works.
Imagine your bookshelf at home. You have hundreds of books, notes, and maybe even some pictures. Now, if you had to find a specific quote from a book or a particular photo, it could take ages. But what if you had an organized system, a magical index, that instantly told you where to find what you’re looking for (definitely not the situation at my home)?
Azure Cognitive Search is like that magical index for digital information.
What is an Index?
In the context of our bookshelf, an index is a list that tells you where specific information is located. Think of it like the table of contents in a book or the catalog in a library. In Azure Cognitive Search, an index does a similar job but for vast amounts of digital data. It helps the system understand where everything is so that when you ask for something, it can find it quickly.
Why is Azure Cognitive Search Useful for Application Developers?
Being a software developer is like being a chef. You’re not expected to farm your ingredients; you just need to cook them. Similarly, as a developer, you shouldn’t have to build a search system from scratch. Azure Cognitive Search is like a pre-prepared ingredient. It’s a ready-to-use, sophisticated search system, saving developers the hassle of ‘farming’ one themselves. By using Azure Cognitive Search, developers can focus on what they do best: building great applications.
The Magic of AI Skills
Imagine if your bookshelf could tell you where a book is and suggest other relevant books, or even summarize the contents for you. That’s what AI Skills in Azure Cognitive Search do. They enhance the search with abilities like understanding the content in images or summarizing large texts. By using AI Skills, the search system becomes smarter, understanding context and making connections, ensuring you find exactly what you’re looking for, and sometimes, even more!
That sounds again as if Azure Cognitive Search does everything for you. But as simple as that, it is not. Appropriate pre- and post-processing of the incoming query respectively of the out coming search results is required to get answers that meet the intention of your query or request.
At first, you must set up the scene in ChatGPT to set the system prompt. The system prompt enables ChatGPT to work as an agent in collaboration with another expert system, in this case realized by Azure Cognitive Search:
Code excerpt of Python source
On the programmatic level, you send to ChatGPT a message array that consists of objects with the attributes role and content. The content that you pass to the role “system” serves as a guideline for the overall background/context of the following conversation. You usually set up this system prompt only once at the beginning of the conversation. But as you see, you need only to set the string variables topic, user_language, source_language and summary_length and ChatGPT can switch from one expert area to another one.
Of course, you also need the topic relevant data with an appropriate index on Azure:
Above you see a data pool for the topic “climate crisis” and another one for the new “industry strategy of Germany” in the Azure cloud. These two data pools inside one Azure blob storage are linked to an Azure Cognitive Search Instance by using for each topic a different index. It is common practice that the blob storage and the Azure Search service run inside one resource group, which bundles the technical resources on one cluster to minimize access and retrieve time.
The whole conversation is mimicked with the following for… loop that receives the questions from a string array called prompt. The answers are returned from the response_request Python function and afterward the answers are placed as context information in the uses ChatGPT message object and additionally the prompt questions and related answers are stored in a CSV file.
The Python function reviseSearchResponse does the above-mentioned post and preprocessing of the user’s prompt input side and the post-processing when feeding the Azure Search result into the ChatGPT response stream.
So why pre- and post-processing is needed?
As one topic pool, I took the document of BMWK (German Ministry for Economy and Climate) regarding its new proposed industry strategy for Germany, addressing the new geopolitical and climate change related challenges of our time.
And then I started to ask, and you will see what problem emerges quite at the start:
The question “Which problems with German industry are discussed in the document?” is a question with a wide range of possibilities for answering it. Though the answer contains significant topics of the document, it is incomplete, why?
Cognitive Search delivers a search result of three thousand words, which covers really all relevant topics, but the ChatGPT 3.5 can handle “only” around 4000 tokens that are again round about 4000*0.75=3000 words. But these 3000 words that ChatGPT 3.5 can handle are reserved for the words it receives, that are already blocked by the system prompt (see above) and for the words it wants to generate. In my system, I used as a threshold value to curb the response of Azure Cognitive Search by 1000 words. By this, you balance as well the response time of ChatGPT which, of course, needs more time for answering a request if it gets a higher load rather than a lower one.
But how to prevent missing relevant parts of your answer. There are many strategies to mitigate the problem, one way is to condense the response of Cognitive Search by sqeezing the text using powerful text summary Python libraries like sumy
So you use another AI which is transferring its text summary of Cognitive Search to ChatGPT, that then finally tries as its best to understand the question and relate its understanding to the condensed search results of Azure Cognitive Search to formulate an appropriate answer. And that it does by the way in incredible fast time.
Is it truly an issue in this context if the initial response to a question isn’t fully complete? You are in a conversation and if I ask a person about a complex subject, I won’t expect that he or she will give me a complete, sufficient answer in one shot, either. It’s the magic of communication that takes place between the talking people and now also talking machines, where a common context is grounded during discussion, which usually broadens your horizon.
Of course, you can fall into traps with this strategy. What happens if the user asks a quite specific question: Can you condense what is told about the microelectronics industry in chapter 2.2 b?
If you have bad luck, the answer of Cognitive Search will be again over 1000 words, you condense this information by sumy and that squeezes all about microelectronics so heavily that the gist of this part of the document gets lost, and you get a flaw answer.
You can mitigate this problem by looking first into the metadata of the Cognitive Search answer. Besides delivering relevant raw text information, it returns a list of relevant persons, locations, organizations and key phrases that are involved in the search results and in there you will find the term “Mikroelektronik” allowing you to seek for this term in the response specifically so that you can deliver to ChatGPT a more narrow but detailed answer as you see above.
With these two simple post-processing steps, checking whether the key terms of your query can be detected in the metadata of your Cognitive Search response respectively using another AI to condense the response to an amount of data ChatGPT can handle, you can manage already many use cases for your chatbot. At least to ask in English a German text and receive a reasonable answer in Chinese or Hebrew:
For me, at least it looks excellent 😉
If you really want to utilize your data by making them accessible using natural language, I can only recommend and encourage you to contact my colleague Volker Luegger. He and his team are experts on this matter and are currently working on proofs of concepts for two of our customers, making their data accessible by chatting.
Enabling business data of a cooperation for natural data access does not “only” require that you deliver appropriate and correct data to your client, but also you must ensure that he or she is allowed to access the data. In cooperations, complex access rules exist that mainly depend on your department and function within your corporation.
In combination with more and more capable speech recognition software like WHISPER from Open.AI, the time that we will access our computers by keyboard, touch display and something like a mouse will fade away, most probably already in a few years.