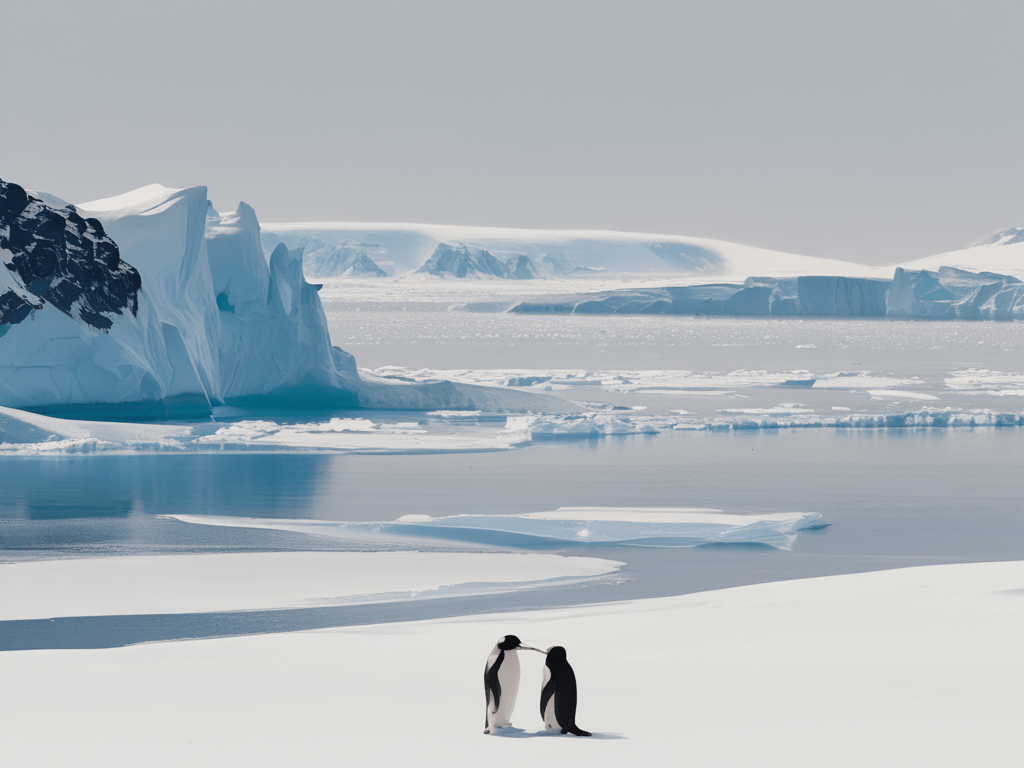
The Antarctica is the last remaining continent on earth which has not been inhabited by humans except for some geoscientists who do research in their special research stations. I don’t think I need to explain why it is like that. It’s a very hostile area for living creatures. It is simply far too cold for us, but around the shore of Antarctica Seals, Whales, Penguins, Albatross, Petrels and many more enjoy Antarctica probably because they don’t see anyone of us.
Antarctica, the last great wilderness, stretches out like a frozen dreamscape at the edge of the world, where endless expanses of pure white ice meet the deep, dark blue of the Southern Ocean. The silence is profound, broken only by the whispers of the wind and the occasional calls of distant seabirds, creating a sense of serene isolation. Here, the sun dances along the horizon during summer, casting a golden glow over towering glaciers, while in winter, the continent slumbers under a blanket of twilight, kissed by the ethereal light of the aurora australis. It’s a place where nature’s beauty is both fierce and fragile, captivating the heart with its untamed, pristine majesty.
Antarctica was often considered less immediately impacted by climate change compared to the Arctic. The perception that Antarctica was somewhat insulated from rapid climate change persisted until relatively recently. However, over the past decade, and particularly in the last few years, the scientific understanding of Antarctica’s vulnerability to climate change has shifted significantly.
Early Observations (Pre-2000s to Early 2010s)
- Stable Ice Shelves and Limited Warming:
- Up to the early 2000s, much of the scientific focus on climate change impacts was directed towards the Arctic, where rapid warming and sea ice loss were more apparent. Antarctica, especially East Antarctica, appeared relatively stable, with some regions even showing cooling trends, which was attributed to the ozone hole and other atmospheric dynamics.
- Early satellite data and climate models indicated that Antarctica, with its extreme cold and vast ice sheets, was less susceptible to the immediate effects of global warming.
- Localized Changes:
- Some localized changes were observed, particularly in the Antarctic Peninsula, which was warming more quickly than the rest of the continent. This region saw the collapse of ice shelves like the Larsen B in 2002, which was an early indication that parts of Antarctica were indeed responding to warming temperatures.
Shifting Understanding (2010s)
- Emerging Evidence of Ice Loss:
- Throughout the 2010s, new satellite data and more sophisticated climate models began to reveal that Antarctica was not as stable as previously thought. Significant ice loss was detected in West Antarctica, particularly in the Thwaites and Pine Island Glaciers.
- Studies published in this period indicated that the West Antarctic Ice Sheet (WAIS) was losing ice at an accelerating rate, contributing to global sea level rise.
- Increased Focus on West Antarctica:
- By the mid-2010s, research increasingly focused on West Antarctica, where the potential for significant ice loss and its implications for global sea level rise became a major concern. The discovery of warm water intrusion beneath key glaciers like Thwaites highlighted how vulnerable this region was to oceanic changes driven by global warming.
- Recognition of Antarctic Ice Loss Contribution:
- By the late 2010s, it became clear that Antarctica was contributing to global sea level rise more significantly than previously believed. Reports from the Intergovernmental Panel on Climate Change (IPCC) began to reflect this, with estimates of Antarctic ice loss being revised upwards.
Significant Change in Perception (2020s)
- Accelerated Ice Loss and Record Low Sea Ice:
- The early 2020s brought a stark realization of Antarctica’s accelerating response to climate change. For example, in 2022 and 2023, studies and observations pointed to record low levels of Antarctic sea ice, which had profound implications for global climate and ocean circulation.
- The rapid retreat of glaciers, particularly in West Antarctica, and the increasing evidence of warming deep ocean waters were major indicators that climate change impacts in Antarctica were accelerating.
- Feedback Mechanisms and Global Implications:
- The most recent research has focused on the feedback loops between ice melt, ocean salinity, and global ocean circulation. This research suggests that the impacts of Antarctic ice loss are not just a regional issue but have global implications, particularly for ocean circulation and weather patterns.
- Shift in Climate Models:
- Climate models in the early 2020s began to incorporate these new findings, leading to a revised understanding of Antarctica’s vulnerability. The realization that Antarctic ice melt could contribute significantly more to sea level rise than previously estimated marked a turning point in how scientists viewed the continent’s role in global climate change.
And this you can personally look up at https://climatereanalyzer.org/clim/seaice/ (selecting “Show Southern Hemisphere”)
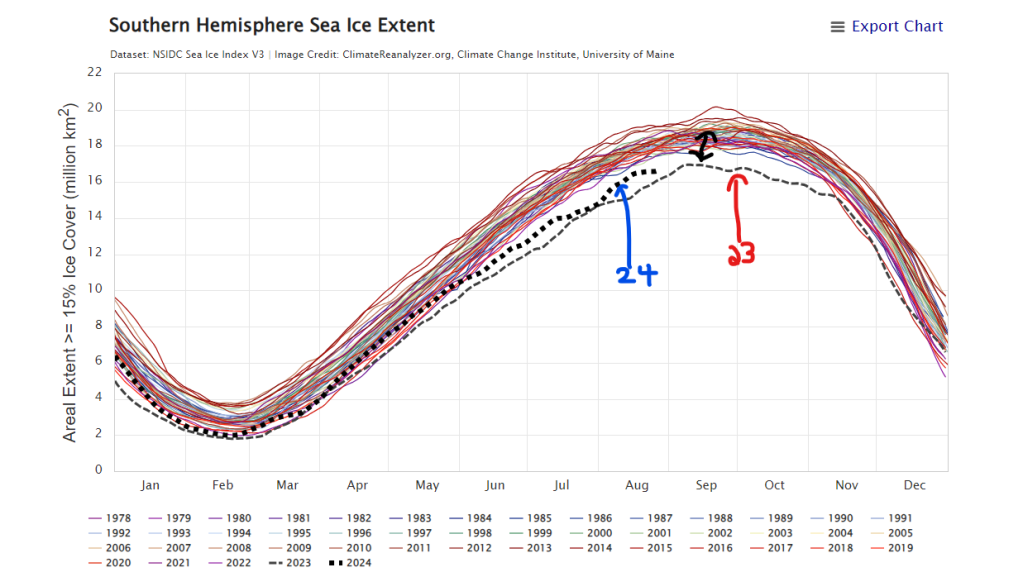
Record Low Sea Ice Levels:
- The diagram, above, shows that Antarctica has experienced record low levels of sea ice. The missing ice area described by the black arrow equals an area of 1.73 million km2 which is an area more than the size of the Iran.
- This reduction in sea ice is not just a surface phenomenon; it has deep implications for the salinity and temperature of the surrounding ocean waters.
Impact of Increased Meltwater:
- The melting of the Antarctic ice sheet, which is shedding ice faster than it can be replenished, is contributing large amounts of freshwater into the Southern Ocean. This influx of meltwater dilutes the salinity of the surface ocean layers, making them less dense.
Stratification and Reduced Water Mixing:
- As the surface water becomes less salty and less dense, it leads to increased stratification in the ocean. Stratification is the layering of water based on density differences, and in this context, it means that the less salty, less dense water remains on top, while the denser, saltier water stays below.
- This stratification reduces the rate at which cold, dense water sinks to the ocean depths. The sinking of this cold water is a critical part of the global ocean circulation system, known as the meridional overturning circulation. A slowdown in this process can have profound impacts on global climate patterns.
Warming of Abyssal Waters:
- A study published in Nature that shows the abyssal (deep) waters around Antarctica are warming. This warming is partly attributed to the reduced sinking of cold, dense water due to the increased stratification caused by the influx of freshwater from melting ice.
- The warming of abyssal waters is problematic because it can lead to further melting of ice shelves from below, particularly at the grounding lines where the ice meets the bedrock. This process, known as “heat erosion”, destabilizes ice shelves and contributes to accelerated ice loss, which in turn adds even more freshwater to the ocean, creating a feedback loop.
Global Ocean Circulation Disruption:
The reduction in salinity and the subsequent impact on deep water formation are not just local issues, but have the potential to disrupt the entire global ocean circulation system. This system is responsible for distributing heat, carbon, oxygen, and nutrients around the planet, so any significant changes can affect marine ecosystems and global weather patterns.
And of course, this layering of water levels of different temperature regions we see on the globe in all sea regions, as described here: Anomalie
You can see it also in closer regions inhabited by many people, like the area of the Mediterranean See:
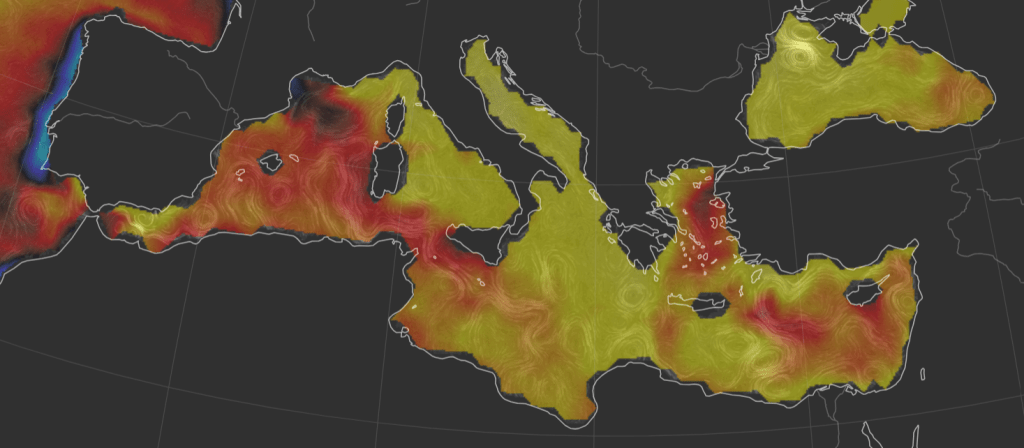
The yellow parts within the Mediterranean and Black See mean that the sea surface temperature is over 5 to 6 degrease Celsius in compare to long-term averages.
The difference between the stratification observerd in the North Atlantic and Antarctica in compare to the Mediterranean See is that we have an effect due to thermal stratification.
The Mediterranean Sea is located in a subtropical region, where it receives significant solar radiation, particularly during the summer months. This results in the warming of the surface waters. Warm water is less dense than cold water, which leads to a strong thermal gradient between the warm surface layers and the cooler deep waters.
Seasonal Variation: During the summer, this warming effect is intensified, creating a distinct thermocline—a layer where temperature decreases rapidly with depth. The thermocline acts as a barrier that prevents the mixing of surface warm water with the cooler, deeper layers, leading to stratification.
But since we see these very high increased sea surface temperatures globally and more than expected, scientists are indeed grappling with understanding why this is happening more rapidly and extensively than expected. Here’s a deeper dive into the current theories and the scientific context:
1. Ocean Heat Uptake
- Absorption of Heat: The oceans have absorbed more than 90% of the excess heat generated by anthropogenic climate change. This heat is not evenly distributed and tends to accumulate more in the upper layers of the ocean, leading to an increase in surface temperatures. As the upper ocean warms, the temperature difference between the surface and deeper layers increases, which enhances stratification.
- Heat Distribution: Because warmer water is less dense, it tends to stay at the surface, preventing the vertical mixing that would otherwise distribute heat more evenly throughout the water column. This lack of mixing contributes to the persistent and intensified stratification seen globally.
2. Increased Stratification: A Positive Feedback Loop
- Reduced Mixing: As the surface layer warms, the increased stratification reduces vertical mixing. This, in turn, allows the surface to warm even further because the heat is not being distributed to deeper layers. This creates a positive feedback loop, where warmer surface temperatures lead to more stratification, which leads to even warmer surface temperatures.
- Impact on Deep Ocean Heat Uptake: The intensified stratification reduces the ocean’s ability to transport heat to deeper layers, meaning more heat stays near the surface. This can further exacerbate the warming of surface waters and contribute to ongoing changes in ocean dynamics.
3. Freshwater Inputs and Global Warming
Global Warming’s Broad Impact: Even in regions without significant freshwater influx, like the Mediterranean or parts of the subtropical oceans, increased atmospheric temperatures are warming surface waters. This is a direct result of global warming, which increases surface temperatures and thus enhances stratification.
Localized Freshwater Influx: In regions like the Arctic and Antarctic, as well as Greenland, large amounts of freshwater from melting ice are being added to the ocean. This freshwater is less dense than seawater, contributing to stratification. However, this is more of a regional effect and doesn’t fully explain the global increase in stratification.
Sources:
https://youtu.be/T0qRoeEcKtY?si=7tjdERR-SBRdabTk
https://www.nature.com/articles/s41586-023-05762-w
Let’s focus again at the process, known as “heat erosion,” in Antarctica which destabilizes ice shelves and contributes to accelerated ice loss, which in turn adds even more freshwater to the ocean, creating a feedback loop.
To understand that, we look at the Thwaites Glazier:
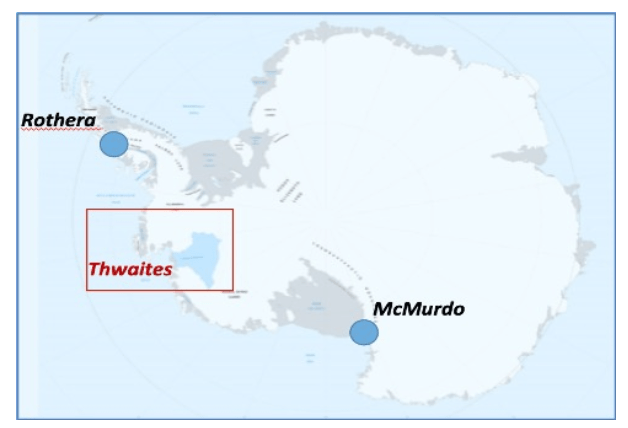
This blue marked area of the Thwaites Glazier is of the size of Great Britain. If Thwaites Glacier was to collapse entirely, global sea levels would increase by 65 cm. But even if so, it takes time to be seen at the shores of our coats. That take decades up to several 100 years but…
The Role of Thwaites Glacier
- Geographical and Structural Position:
- The Thwaites Glacier is located in West Antarctica, and it sits on a bed that slopes downward inland. This means that much of the glacier is grounded below sea level, and the ice sheet behind it is resting on bedrock that also lies below sea level. This configuration makes Thwaites particularly vulnerable to warming ocean waters.
- Plug Analogy:
- Thwaites Glacier acts like a “plug” or “cork” because it currently restrains the flow of ice from the interior of the West Antarctic Ice Sheet into the ocean. Imagine a large dam holding back a reservoir of water: the dam acts as a barrier, preventing the water from flowing freely. Similarly, Thwaites Glacier helps to slow down the movement of ice from the larger WAIS into the Amundsen Sea.
- Protection of Other Glaciers:
- The glacier’s presence and stability help to “protect” other glaciers and the overall ice sheet behind it. If Thwaites were to retreat significantly or collapse, it would essentially “unplug” the ice sheet, removing this stabilizing force. Without the restraining effect of Thwaites, other glaciers in the region—such as Pine Island Glacier, which is also a major contributor to sea level rise—would likely begin to flow more rapidly into the ocean.
- Consequences of Thwaites’ Retreat:
- If Thwaites Glacier retreats past a certain tipping point, it could lead to a chain reaction where large portions of the WAIS begin to collapse. This would allow much more ice to flow into the ocean, greatly accelerating sea level rise.
- The retreat of Thwaites would not only increase its own contribution to sea level rise but also destabilize surrounding ice, potentially leading to the collapse of adjacent glaciers. This is why Thwaites is often called a “keystone” or “linchpin” in the region.
That sounds quite scary and in fact it is and most probably that’s why the Thwaites Glacier is also called “Doomed Glacier“.
But not, yet, I have explained how the “heat erosion” works in Antarctica. A helpful page to understand this is given here: https://thwaitesglacier.org/index.php/news/warm-seawater-speeding-melting-thwaites-glacier. On the home page: thwaitesglacier.org you will find the following YouTube video: https://youtu.be/MR6-sgRqW0k?si=S-6o1d5_nrjt-00F which I really recommend to watch.
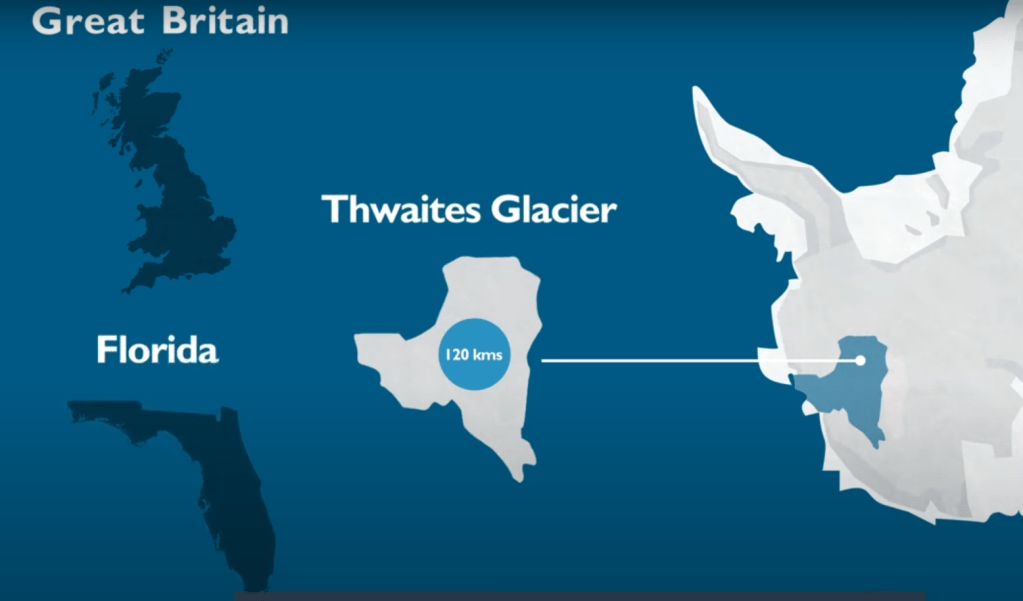
The preceding picture gives a good sense of the size of Thwaites Glacier in area with an ice thickness of 1 km and why it is regarded as a plug.
If you continue the video you will encounter the following animation:

In this animation, the Thwaites Glacier is a massive ice block located on a hard bed rock. As you see, the ice and the bed rock are below sea level. But with warmer sea surface water as described in the preceding parts, this warmer water deepens a gap between the bed rock and the top ice levels, causing the following result:

The top ice levels floating increasingly on water break up into pieces since the warmer water and the tensions that underneath floating water creates by its waves.
These feedback mechanisms and tipping points involved in ice sheet dynamics are complex and not fully understood, which makes precise predictions difficult. However, there are some key insights from the research that point to the potential scale of the impact:
Potential Doubling of Sea Level Rise
The idea that sea level rise could potentially double comes from specific studies and advanced modeling efforts that attempt to incorporate some of these previously underestimated or overlooked processes:
- Grounding Zone Feedbacks:
- Researchers have looked at how warm ocean water might intrude beneath ice shelves, particularly at the grounding zones where the ice transitions from resting on the bedrock to floating on the ocean. This intrusion could lead to much more rapid melting than previously estimated.
- When models include this process, they suggest that the rate of melting—and therefore the contribution to sea level rise—could be significantly higher. In some cases, this could lead to estimates of sea level rise being up to twice as high as what is currently projected.
- Dynamic Ice Sheet Responses:
- The potential for sudden, large-scale changes in ice sheet behavior—triggered by relatively small changes in temperature or ocean currents—is not fully accounted for in many models. If these dynamic responses are more sensitive than we currently think, the resulting sea level rise could indeed be much higher.
- Some studies have suggested that including more accurate representations of these dynamics could lead to sea level rise projections that are roughly double the current estimates.
Why Quantification is Difficult
- Complex Interactions: The interactions between ice, ocean, and atmosphere involve numerous variables that can change in nonlinear ways, making it hard to predict exactly how much they will contribute to future sea level rise.
- Limited Historical Data: Because these processes are complex and some of them might only occur under certain conditions, we don’t have a long history of data to draw on for making precise predictions.
- Uncertainty in Climate Trajectories: The exact amount of future sea level rise also depends heavily on future greenhouse gas emissions and how quickly the planet warms, which adds another layer of uncertainty.
Anyhow, from my point of view, the future perspective looks very grim.
Sources: https://youtu.be/rRlEoS7X4q8?si=dF5Mhk6RSuHq8MNz, https://youtu.be/InhMCJro6hA?si=vjmc-pGxcJwv8RZr
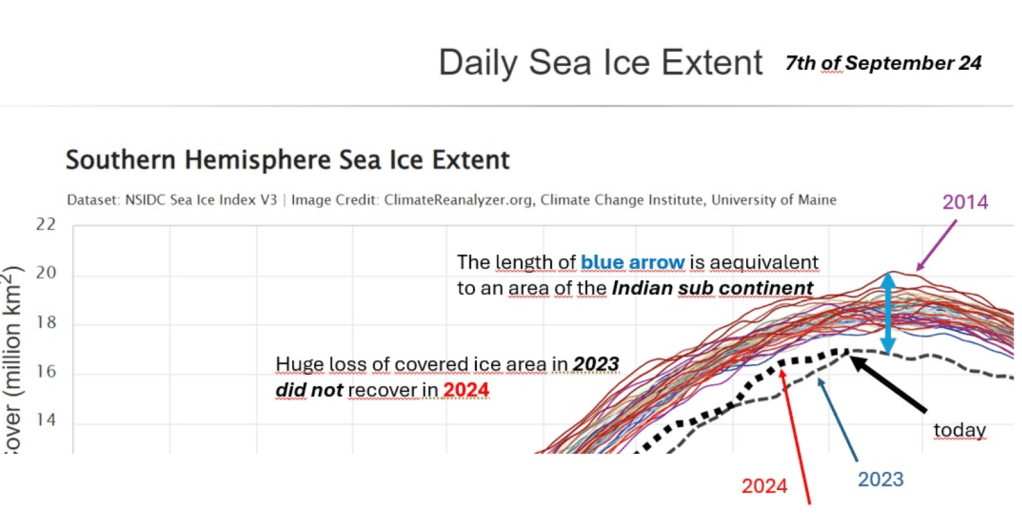
Update: Alarming Decline in Southern Hemisphere Sea Ice Extent
The latest data on sea ice extent in the Southern Hemisphere, as of September 7, 2024, reveals an unprecedented decline in ice coverage. As illustrated in the graph, the sea ice extent has plummeted to historically low levels, raising serious concerns about the escalating impacts of climate change on Antarctica.
The 2024 data, represented by the dotted black line, shows no recovery from the huge loss of ice area experienced in 2023.
The loss visualized by the gap between the ice peak coverage in 2014 and today’s values is alarming, with a difference equivalent to the entire area of the Indian subcontinent. This scale of ice loss underscores the severity of the situation, as we observe the consequences of rapid warming and changing oceanic conditions.
Additionally, the upper line representing 2014 (purple arrow) gives us a poignant reminder of how quickly this decline has accelerated. In less than a decade, we have witnessed a dramatic reduction in ice extent, reflecting a rapid shift from one of the highest recorded levels to the lowest.
