Many people say that we are currently living in a time of high uncertainty. I go a step further and assert that we are doomed, despite the numerous measures we’ve already taken to reduce global warming. These efforts are simply not enough. Furthermore, global warming is definitely not our only problem.
This might sound like a typical hysterical internet message, but I want to explain why I believe this. Hopefully, I am wrong in my conclusions, but let’s give them a try.
I compare the current world situation to the scene of the sinking Titanic one hour after the collision. The engineering crew becomes increasingly aware that this collision marks a point of no return. The ship will sink; the only question is how quickly it will go down.
Now, let’s come back to the year 2024, 112 years later.
Our ship today is called Earth, a very, very tiny planet in the seemingly endless universe.

Earth seen from 6 billion km. The picture was taken by Voyager I in 1990.
On April 22, 2016, representatives of the global community signed an agreement intended to lead the initiative in limiting global warming induced by incredibly high CO2 consumption: The Paris Agreement. The nations agreed to start initiatives to prevent global warming from exceeding 1.5 degrees Celsius above pre-industrial levels. This target was not chosen accidentally. Climate scientists proposed this threshold to limit the chances of triggering ecological tipping points. Moreover, the less the atmosphere and seas warm, the less we will face extreme weather events. This scenario would also give future generations enough time to scale up technologies for highly effective carbon capture from the atmosphere.
The technical counterpart of the Paris Agreement is the RCP 2.6 scenario. RCP stands for Representative Concentration Pathway, and the 2.6, which can be confusing, refers to 2.6 Watts per square meter (a measure of energy intensity) rather than temperature. Imagine covering the whole planet with a blanket. This blanket holds back radiation from the Earth, induced by sunlight. The industrial CO2 blanket has already caused an increased radiation of 2 Watts per square meter. The RCP 2.6 scenario proposes a global CO2 emission plan to ensure that the blanket does not get denser than an additional 2.6 Watts per square meter.
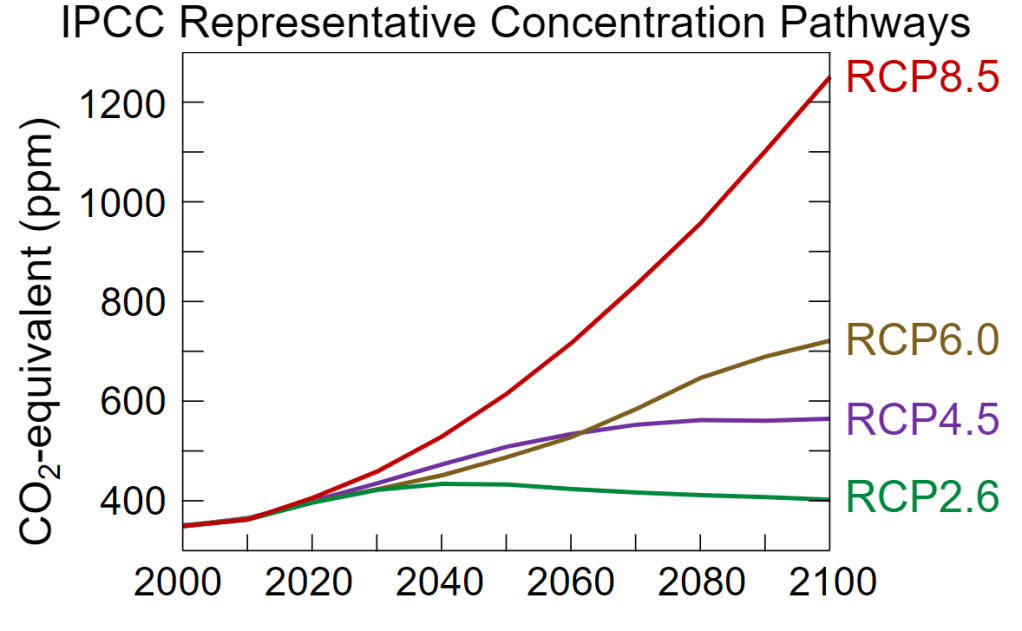
In the modest climate scenario, RCP 2.6, the CO2 concentration would peak between 2040 and 2070 at around 440 ppm (parts per million) and then decrease due to natural CO2 absorption through photosynthesis. However, we are already at a concentration of 425 ppm today (source: NASA).
Key Targets and Proposals for CO2 Emission Reductions by 2030 under RCP 2.6:
By 2030:
- Emission Reduction: RCP 2.6 aims for a 40-50% reduction in global CO2 emissions compared to 2010 levels by 2030.
- Annual Reduction Rate: This translates to an average annual reduction of 3-4% from current levels.
- Total Emissions: The target is to bring down global CO2 emissions to around 20-24 billion tonnes by 2030.
By 2040:
- Further Reduction: Emissions should continue to decline, reaching about 70% below 2010 levels by 2040.
Key Strategies:
- Transition to Renewable Energy: Substantial increases in renewable energy deployment, especially solar, wind, and hydro.
- Energy Efficiency: Enhancing energy efficiency across all sectors.
- Electrification: Electrifying transportation and other sectors currently reliant on fossil fuels.
- Carbon Capture and Storage (CCS): Implementing CCS technologies to reduce emissions from industrial sources.
- Land Use Changes: Increasing carbon sequestration through reforestation and improved land management.
Focus on the First Target
To align with RCP 2.6, we need to reduce global CO2 emissions by 40-50% relative to 2010 levels by 2030. Let’s assess what has been achieved so far. Surprisingly, the progress is more substantial than one might think.
For the following numbers, I reference reports from the International Energy Agency (IEA), primarily the latest from 2023.
Further Sources are: https://www.globalcarbonproject.org/ and https://www.carbonbrief.org/analysis-chinas-co2-emissions-hit-q1-record-high-after-4-rise-in-early-2023/
To understand how close or far we are from achieving a 40-50% reduction in global CO2 emissions compared to 2010, we need to compare the figures of 2010 and 2023 and project the trends until 2030.
CO2 Emissions in 2010
The numbers for 2010 are derived from historical emissions’ data, such as those provided by the Global Carbon Project and other reliable environmental agencies.
Emission Shares in 2010:
- China: 7.94 billion tonnes (24%)
- USA: 5.30 billion tonnes (16%)
- India: 1.99 billion tonnes (6%)
- European Union (including the UK): 4.1 billion tonnes (12%)
- All Others: 13.90 billion tonnes (42%)
- Total Global Emissions: 33.23 gigatonnes
CO2 Emissions in 2023
These numbers are based on the most recent data and projections from the International Energy Agency (IEA) and the Global Carbon Project.
Emission Shares in 2023:
- China: 11.41 billion tonnes (31%)
- USA: 5.15 billion tonnes (14%)
- India: 2.94 billion tonnes (8%)
- European Union: 2.58 billion tonnes (7%)
- All Others: 15.32 billion tonnes (40%)
- Total Global Emissions: 37.4 billion tonnes (100%)
Analysis
Comparing the data between 2010 and 2023, it’s evident that global CO2 emissions have increased by 11% instead of decreasing. Among the major emitters, only Europe has managed to reduce its carbon footprint significantly. The US emissions have stagnated, while China’s emissions have grown substantially.
Sources
- Global Carbon Project: Provides comprehensive data on global carbon emissions, including historical and current emissions.
- Global Carbon Project 2023 Report
- Global Carbon Budget
- European Environment Agency (EEA): Tracks and reports on emissions’ data for European countries.
- EEA CO2 Emissions Data
Emission Trends from 2000 to 2023
To illustrate the development of CO2 emissions more clearly, let’s look at the emission trends in graphs between 2000 and 2023. The graphs will show how emissions have changed over time for key regions and globally.
This section sets the stage for an in-depth analysis of the progress and challenges in meeting the RCP 2.6 targets by 2030. The graphical representation of emission trends will provide a visual understanding of the changes and highlight the urgency of accelerating emission reduction efforts.
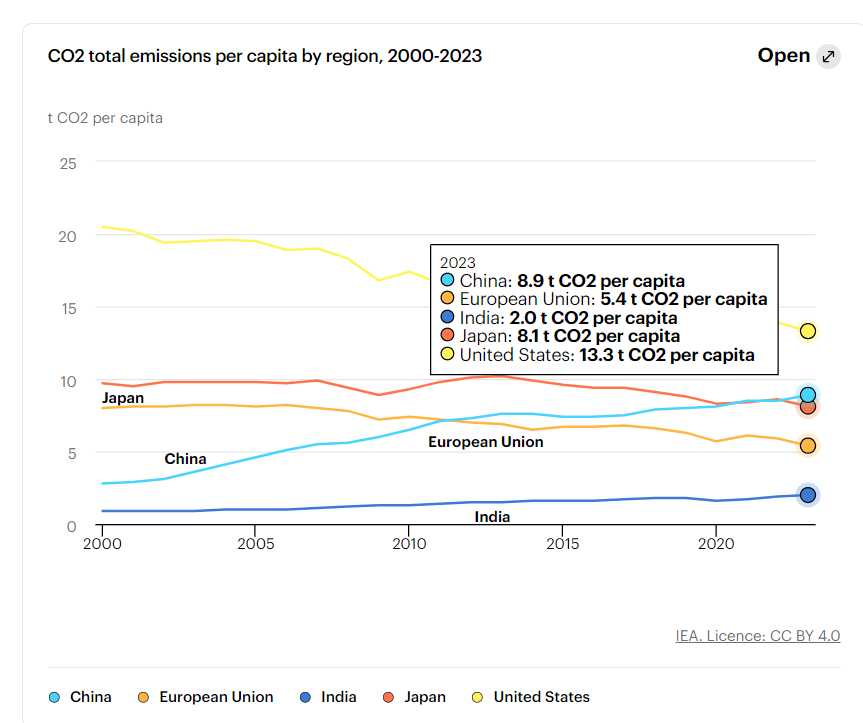
CO2 Emissions Per Capita in Major Regions
As illustrated above, the CO2 emissions per capita for the major regions of our planet reveal stark differences. The United States, still a leading world power, also leads in per capita CO2 emissions with 13.3 tonnes per person. Europe is on a downward trend and, if it continues to reduce its carbon footprint by 1.3% per year, it will achieve a 40% reduction compared to 2010 levels. Between 2022 and 2023, Europe even managed a remarkable 7% reduction, although maintaining this rate is unlikely due to technical and political challenges. Nevertheless, a 1.3% annual reduction until 2030 seems realistic for Europe.
It’s also noteworthy that India’s per capita footprint remains significantly lower than that of other regions, though it is steadily increasing.
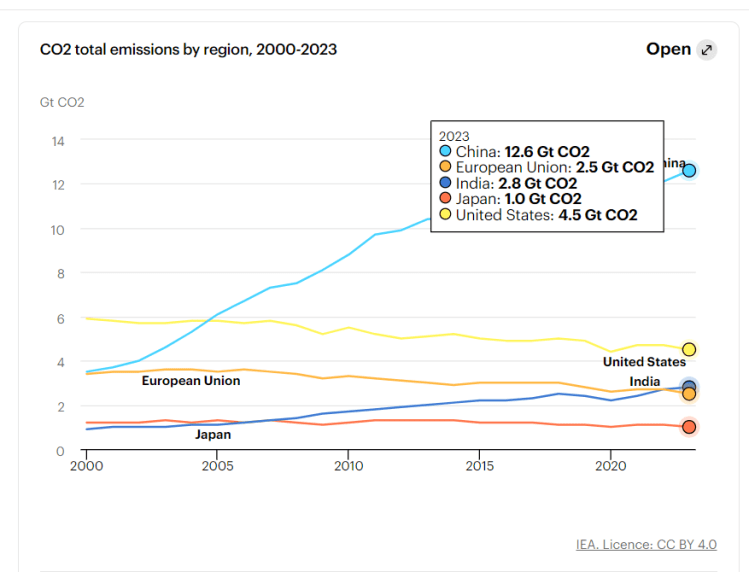
Global CO2 Emission Picture
To obtain a more realistic picture of the global CO2 emission situation, it’s essential to multiply the per capita figures by the number of inhabitants in each region. This approach provides a comprehensive view of the total emissions and highlights the impact of population size on global CO2 output.
The Rise of the Dragon and Global CO2 Emissions
The significant climate effects observed from 2000 onwards are often attributed to the rise of China, frequently referred to as the “Dragon.” However, blaming China alone for these climate impacts is not the correct conclusion. Let’s examine why.
CO2 Emissions Per Capita
China:
- Per Capita Emissions: 8.1 tonnes
- Total Emissions: 11.41 billion tonnes
Germany:
- Per Capita Emissions: 7.5 tonnes
Germany’s per capita emissions are only slightly lower than China’s. When considering that China produces a significant amount of industrial goods for Europe and the US, some of the emissions attributed to China should arguably be redistributed to these regions’ balance sheets. Additionally, the historical context is crucial: Europe and the US were major contributors to the Industrial Revolution from the 18th century onwards, and CO2 molecules can remain in the atmosphere for up to 1,000 years. This historical accumulation is a major factor in the current climate crisis.
Historical Contributions and Economic Policies
For a long time, the economic and political opening of China was welcomed by Europe and the US, despite knowing that if China followed the same industrialization path, it could significantly destabilize global ecosystems. This was highlighted in the “Limits to Growth” report in the 1970s.
India’s Growing Emissions
The data also show that India’s total emissions have already surpassed those of Europe on an absolute level.
India:
- Per Capita Emissions: 2.2 tonnes
- Total Emissions: 2.94 billion tonnes
Given its large population and rapid economic growth, India could potentially see a rise in emissions similar to China’s recent history. The question then arises: Will we witness a similar CO2 explosion with the rise of India?
What does the IEA expects now as global CO2 emission for the 2030?
Global CO2 Emissions in 2030
- Total Global Emissions (projected for 2030): The IEA projects that global CO2 emissions could peak around 2025 and then start to decline. By 2030, total emissions are projected to be approximately 32-33 billion tonnes if significant emission reduction measures are implemented globally.
Contributions from Major Emitters in 2030
- China: Expected to peak around 11.6 to 11.8 billion tonnes by 2030.
- USA: If the USA reduces emissions by 5% annually from 2024, emissions will be approximately 3.79 billion tonnes by 2030.
- European Union: Targeting to reduce emissions to 2.46 billion tonnes by 2030.
- India: Projected to have emissions around 3.8 to 4.1 billion tonnes by 2030.
Source
https://www.rff.org/publications/reports/global-energy-outlook-2022/
32-33 billion tonnes of CO2 emissions globally mean that there is no reduction between 2010 and 2030 and the RCP 2.6 scenario is definitely history.
Let’s come back to this diagram again:
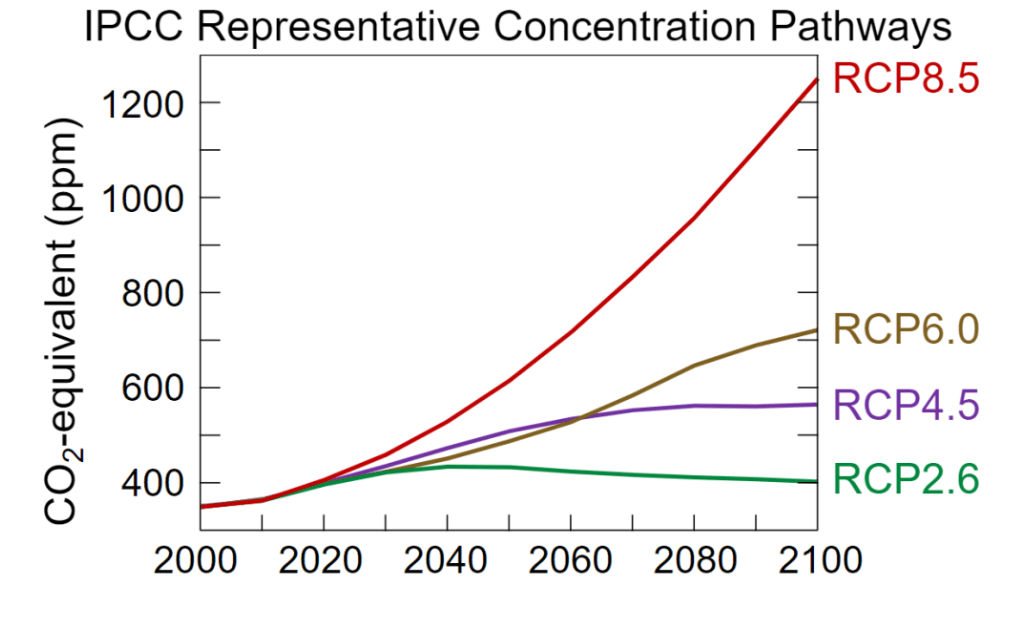
If emissions stagnate at 33 billion tonnes until 2033 and then begin to slowly decline, the pathway would be more aligned with the RCP 4.5 or RCP 6.0 scenarios. These scenarios assume delayed peak and gradual declines in emissions, reflecting slower and less aggressive mitigation efforts compared to RCP 2.6.
RCP 4.5: A stabilization scenario where emissions peak around 2040 and then decline, aiming for a concentration of around 650 ppm CO2-equivalent by 2100. This scenario assumes intermediate levels of greenhouse gas mitigation.
What are the implications of RCP 4.5?
- Temperature Rise: Aligning with RCP 4.5 or RCP 6.0 would likely result in a global temperature increase of approximately 2.5°C to 3°C by the end of the century. This is higher than the targets set by the Paris Agreement, which aims to limit warming to well below 2°C, preferably to 1.5°C.
- Climate Impact: Higher temperature increases would lead to more severe climate impacts, including extreme weather events, sea-level rise, and disruptions to ecosystems and human societies (refer as well to: https://chrisfaustulus.com/2023/10/02/tip-overgame-over/#oecd).
So, you may finally ask why I call this blog 95%? With my name, I can announce any fist rule or fist number. I assume that we fail miserably in handling the climate crisis by 95%. But still, I see at least a chance that we can get off more cheaply, but only with a chance by 5%, but never we will come out of this ecological crisis without paying a high price.
But much more, I think we will pay an incredible high price. So what could be a dystopian scenario? Let’s look at this diagram: (https://climatereanalyzer.org/clim/sst_daily/)
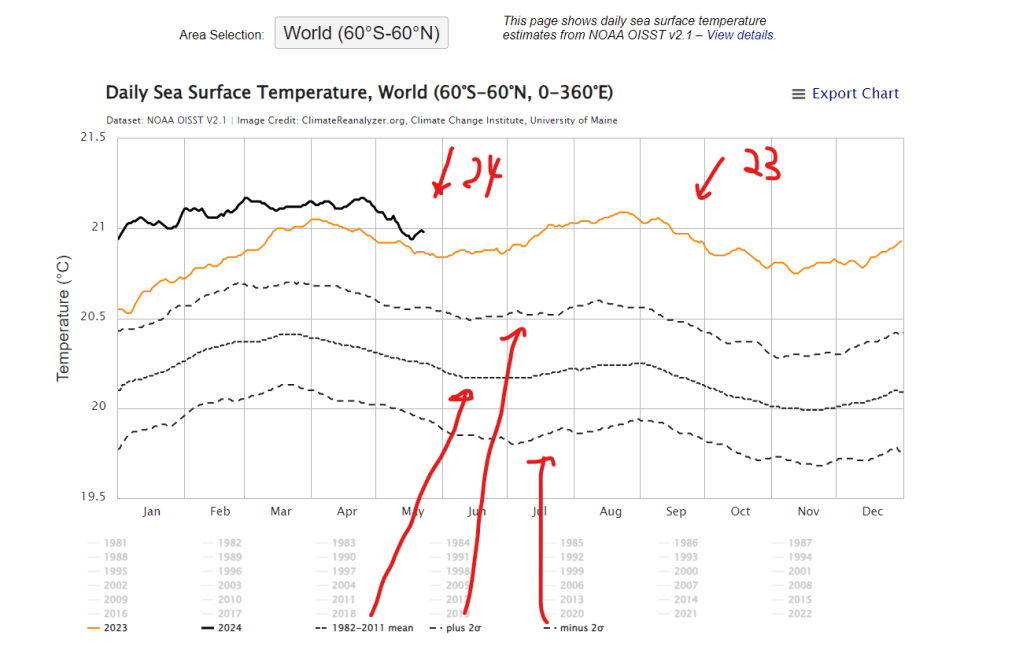
In 23, the sea surface temperature really jumped up far over the two sigma deviation of the long-term mean from 1982 to 2011. We are talking about +0.5 degrees over the plus 2 sigma deviation, so one degree over the long-term mean of 1982-2011. The science is quiet and concerned about this “effect”. They cannot explain why suddenly such an increase in the sea surface temperature is given. They go back to their models to figure out what they missed, but definitely it is not a good sign. Such high sea surface temperatures also explain, why you get such a curve:
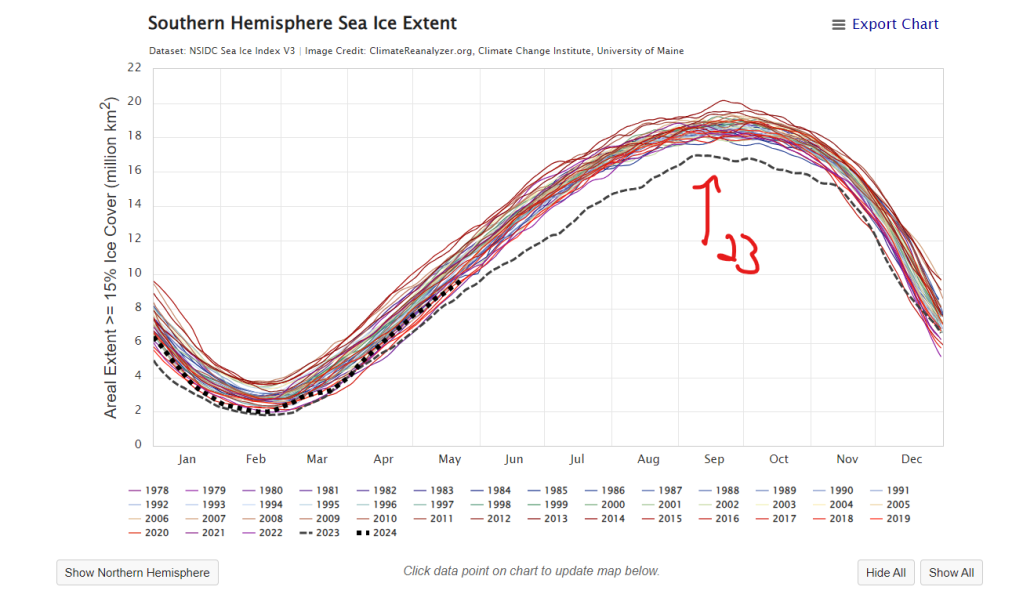
You see for 23 a tremendous loss of ice recovery at the south pol in the winter period of the Southern Hemisphere. As water has a much higher temperature capacity than air, the water temperature won’t get down so easily, and that’s terrible news for the corrals in the seas (https://chrisfaustulus.com/2024/04/17/das-leiden-in-den-meeren/). This will have a tremendous bad impact on the global food chain. Moreover, Corrals are critical for coast protection because they act as natural barriers that reduce wave energy and erosion, thus protecting shorelines from storm surges and coastal degradation. In combination with stronger and stronger getting storms, that is a horrible combination. So I assume that this will be the first tipping point that will fall (and it has been tipping already quite a while). It is not that spectacular, like the interruption of the AMOC (https://chrisfaustulus.com/2024/02/29/the-amoc/) but very effective because this tipping over happens quietly under the sea and the damages on the food chain take time until we really recognize them, and so we will act again too late.
You might ask why I then see anyhow a 5% chance of improvement?
While the Earth’s existence is not in question, the quality of life and the stability of ecosystems are at significant risk. By taking radical, collective action, we can mitigate the worst impacts of climate change and give our planet the chance to recover. This approach requires unprecedented global cooperation and a willingness to prioritize the long-term health of our environment over short-term economic gains.
If we treat the Earth as a patient in need of critical care, we might just be able to stabilize the situation and ensure a livable planet for future generations.
So what chance do I see that we could avoid the worst development seen from current perspective in 2024? Let’s treat our planet as a very sick patient that should be put into a coma to give the Earth rest to recover.
What this could look like?
The Crisis Mode
1. Global Economic Shutdown:
- Immediate Halt: A coordinated international agreement mandates a halt to non-essential economic activities. Industries, transportation networks, and non-critical services are paused.
- Essential Services: Only critical activities such as food production, healthcare, and basic utilities remain operational. These sectors operate under strict environmental guidelines to minimize emissions.
2. Renewable Energy Transition:
- Massive Investment: Governments and private sectors redirect funds to accelerate renewable energy projects. Solar, wind, and hydroelectric power installations receive unprecedented support and fast-tracked approvals.
- The IEA (not the global green parties of the planet) tells: Investment in clean energy needs to increase significantly, particularly in emerging and developing economies, where investment must rise by more than five times by 2030 to meet the Paris Agreement/ RCP 2.6.
- Research and Development: Increased funding for R&D in energy storage, grid modernization, and sustainable technologies to ensure a resilient renewable energy infrastructure.
3. Emission Reduction Measures:
- Strict Regulations: Enforce stringent emission controls on the remaining operational sectors. Implement carbon capture and storage (CCS) technologies where feasible.
- Carbon Tax: Introduce a high carbon tax to disincentivize any remaining fossil fuel use and generate revenue for climate initiatives.
4. Public Adaptation and Support:
- Community Engagement: Mobilize communities to support local food production, energy-saving practices, and sustainable living. Encourage urban farming and local supply chains.
- Education Campaigns: Launch global campaigns to educate the public on the importance of the measures, climate change impacts, and how they can contribute to the transition.
5. International Cooperation:
- Unified Response: Countries collaborate to share resources, technology, and knowledge. Wealthier nations support developing countries in adopting renewable technologies.
- Global Governance: Establish a global climate council to oversee and coordinate efforts, ensuring equitable distribution of resources and adherence to climate goals.
Implementation Plan
Phase 1: Preparation (0-6 months)
- Assess and prioritize essential services.
- Develop and disseminate guidelines for the shutdown and renewable transition.
- Initiate funding reallocation and R&D efforts.
Phase 2: Shutdown and Transition Kickoff (6-24 months)
- Enforce the shutdown of non-essential sectors.
- Ramp up renewable energy projects and infrastructure upgrades.
- Implement emission reduction measures and carbon tax.
Phase 3: Stabilization and Adaptation (24-60 months)
- Monitor and adjust the shutdown measures based on environmental impact and societal needs.
- Continue expanding renewable energy capacity.
- Foster public adaptation through ongoing education and community support initiatives.
Phase 4: Long-Term Sustainability (Beyond 60 months)
- Gradually reintroduce economic activities under new, sustainable frameworks.
- Ensure ongoing global cooperation and compliance with climate goals.
- Maintain and enhance renewable energy systems and environmental protections.
The “climate coma” scenario requires unprecedented global cooperation, significant investment in renewable energy, and a societal shift towards sustainable living. While drastic, these measures are essential to avert the worst impacts of the climate crisis and secure a livable planet for future generations. The success of this scenario hinges on our collective will to act decisively and prioritize the Earth’s health over short-term economic gains.
If you look at the last part, you will agree that my 5% estimation for less critical climate scenario is a very positive estimation. We have been falling back to big wars, are on the brink even of a potential global war, why we should suddenly cooperate?
I see a short window at the beginning of the 30ties of this century. In this period, weather impacts can already be so drastic that a global majority of people recognize that such “climate coma” is the last chance to avoid the worst scenarios.
Probably I should lower this chance to five per mill, but I don’t do it to keep my faith up for tough times that are ahead of us and I ask kindly anyone who has managed to read the blog until here, please do everything to increase the 5%.

One thought on “95%…”